Cloud Monitoring Service (CMS)
Product Updates
| Version | Functional Description | Release Time |
|---|---|---|
| v.1.27.0 | Event Monitoring | 2025-6-30 |
Product Overview
What is Cloud Monitoring?
SenseCore Cloud Monitor Service (CMS) is a comprehensive cloud product resource monitoring platform, which is intended for guaranteeing the stable operation of various businesses.
As an enterprise-level out-of-the-box monitoring product, CMS provides SenseCore cloud products with comprehensive monitoring, visualization, and flexible alarm functions from multiple dimensions such as infrastructure, system services, and running tasks, helping users fully understand the resource usage and business operation state, and reduce operation and maintenance costs while ensuring continuous business operation.
CMS mainly has the following functions:
- Cloud product monitoring
Support integration with multiple cloud products, enabling users to conveniently view the health states and other metrics of the target resources of each cloud product and obtain an insight into the monitoring states of the cloud products.
- Log query
Support the collection of various types of log information and queries according to specific syntax rules, and combine with the monitoring functions of other cloud services to enrich query dimensions, forming a complete closed-loop monitoring system.
Event Monitoring Record changes in system or resource status to ensure that users are promptly informed of task updates and can take appropriate actions.
Quick alarm
Provide flexible configuration of alarm rules and send an alarm notification when the monitoring data reaches the alarm threshold, enabling users to know exceptions, query the causes of the exceptions, and handle the exceptions in time.
- Monitoring dashboard
Support the creation of dedicated monitoring dashboards for different cloud products and provide rich configuration metrics and diverse visualization forms, enabling users to grasp the resource state of each cloud product in a clear and intuitive way.
Product Superiority
CMS is derived from SenseTime's years of internal experience and characterized by simple operation, consistency of monitoring experience, diversity of metrics, and alarm flexibility.
- Out-of-the-box solution
After activating cloud service resources, you can view the metric monitoring of all cloud products through CMS and configure alarm policies. The operation process is simple and easy.
- One-stop monitoring
CMS covers hundreds of monitoring metrics of all cloud services of SenseCore. You can view metric data of various dimensions from a unified perspective and configure alarm policies on demand.
- Flexible alarming
CMS supports 24/7 monitoring and alarming, provides flexible alarm rules and multiple notification modes, and sends notification messages in time when resources have exceptions.
Application Scenarios
AI Training Protection
CMS does not need to be purchased separately. After activating cloud resources for AI task training, you can directly start the monitoring visualization of AI training tasks, cloud labs, and underlying resources, and configure alarms, so that when there are problems with the training tasks or the underlying resources have exceptions, you can quickly know and solve the problems and exceptions.
- Natively support the monitoring of the core metrics of each cloud product and provide out-of-the-box monitoring views
- Provide flexible alarm rule configuration and multiple notification modes including SMS, email, and WeCom
- Provide different types of log information records and multiple query methods to enrich monitoring dimensions
Resource Operation Management
Build a resource operation dashboard through cloud monitoring, and manage dynamically changing large-scale cloud resources from a high-dimensional perspective. Combined with subdivided cloud product monitoring views and definitions of alarm rules, fully understand the resource operation state and grasp dynamic information in real time.
- Provide an overview of resource operation through the extraction and integration of the core metrics of each cloud product
- Support multi-service and multi-dimensional monitoring data through the custom cloud service monitoring dashboard, and present the information that users focus on in a centralized manner
- Configure alarm policies according to business operation requirements, and synchronize resource changes timely through SMS, email, and WeCom
Basic Concepts
| Term | Definition |
|---|---|
| Cloud Product Monitoring | Cloud product monitoring is a function of CMS to monitor the cloud service of SenseCore, and you can view the monitoring items in each cloud product under the current account. |
| Cloud Service | Cloud service is the general term for cloud products and cloud services provided by SenseCore, such as: AI Compute Pool (ACP), Cloud Container Instance (CCI), and AI File Storage (AFS). |
| Monitoring Metric | The default monitoring data type of the system. For example: total cluster IOPS (read/write) and total cluster bandwidth (read/write) of AFS, etc. |
| Alarm Service | Users can set alarm rules for monitoring items in cloud product monitoring. When a monitoring item meets an alarm rule, an alarm notification is sent. |
| Alarm Rule | A user-defined monitoring item alarm condition. When a monitoring item meets the alarm condition, the user will receive an alarm notification. |
| Alarm Template | Confirm to delete alarm template An alarm template is a set of alarm rules based on services, which can help users quickly create alarm rules for multiple cloud services, greatly improving the work efficiency of maintenance personnel. |
| Notification Mode | The modes of sending alarm notifications, including: email, SMS, WeCom, DingTalk, webhook, etc. |
Concept of Computing Metrics
Only for distinguishing the concepts among utilization, usage, load, and occupation. Not all of the following metrics are provided.
CPU Metrics
| Metric | Name | Meaning |
|---|---|---|
| CpuUsage | CPU usage | Non-idle time/total time of all CPU logic processors within xx seconds. Percentage of time in non-idle state, for example, 25% for two logic processors and 50% for one logic processor. There are four logic processors in total. Then the CpuUtilization is 25% |
| CpuUtilization | CPU utilization | Non-idle time/total time of all CPU logic processors within xx seconds. Percentage of time in non-idle state, for example, 25% for two logic processors and 50% for one logic processor. There are four logic processors in total. Then the CpuUtilization is 25% |
| CpuProcessUsage | CPU process usage | Non-idle time of all CPU logic processors/time of a single logic processor within xx seconds. for example, 25% for two logic processors and 50% for one logic processor. There are four logic processors in total. Then the CpuProcessUtilization is 100% |
| CpuProcessUtilization | CPU process utilization | Non-idle time of all CPU logic processors/time of a single logic processor within xx seconds. for example, 25% for two logic processors and 50% for one logic processor. There are four logic processors in total. Then the CpuProcessUtilization is 100% |
| CpuLoadAvg | CPU average load | Average number of tasks using and waiting to use CPU within xx seconds |
| CpuOccupation | CPU occupation | The number of all CPU logic processors allocated/the number of all logic processors |
GPU Metrics
| Metric | Name | Meaning |
|---|---|---|
| GpuUtilization | GPU utilization | Utilization defined using NVIDIA DCGM. (Non-idle time/total time of all GPUs within xx seconds. Percentage of time in non-idle state.) |
| GpuUsage | GPU usage | Usage defined using NVIDIA DCGM. (Non-idle time/total time of all GPUs within xx seconds. Percentage of time in non-idle state.) |
| GpuOccupation | GPU occupation | The number of all GPUs allocated/the number of all GPUs |
| GpuMemUsage | GPU memory usage | Memory usage/total memory of all GPUs |
| GpuMemTotal | GPU total memory | Total memory of GPUs |
| GpuPowDraw | GPU power draw | Power draw of all GPUs |
| GpuPowUsage | GPU power usage | Power usage of all GPUs |
| GpuTemp | GPU temperature | Used to evaluate the cooling state of GPUs |
Quick Start
Cloud Product Monitoring
Application Scenarios
You can use Cloud Product Monitoring to uniformly monitor the resources you have ordered and purchased in various cloud products. Cloud Product Monitoring provides multi-dimensional monitoring metrics and diverse display forms to clearly and intuitively display the health status and operation status of resources.
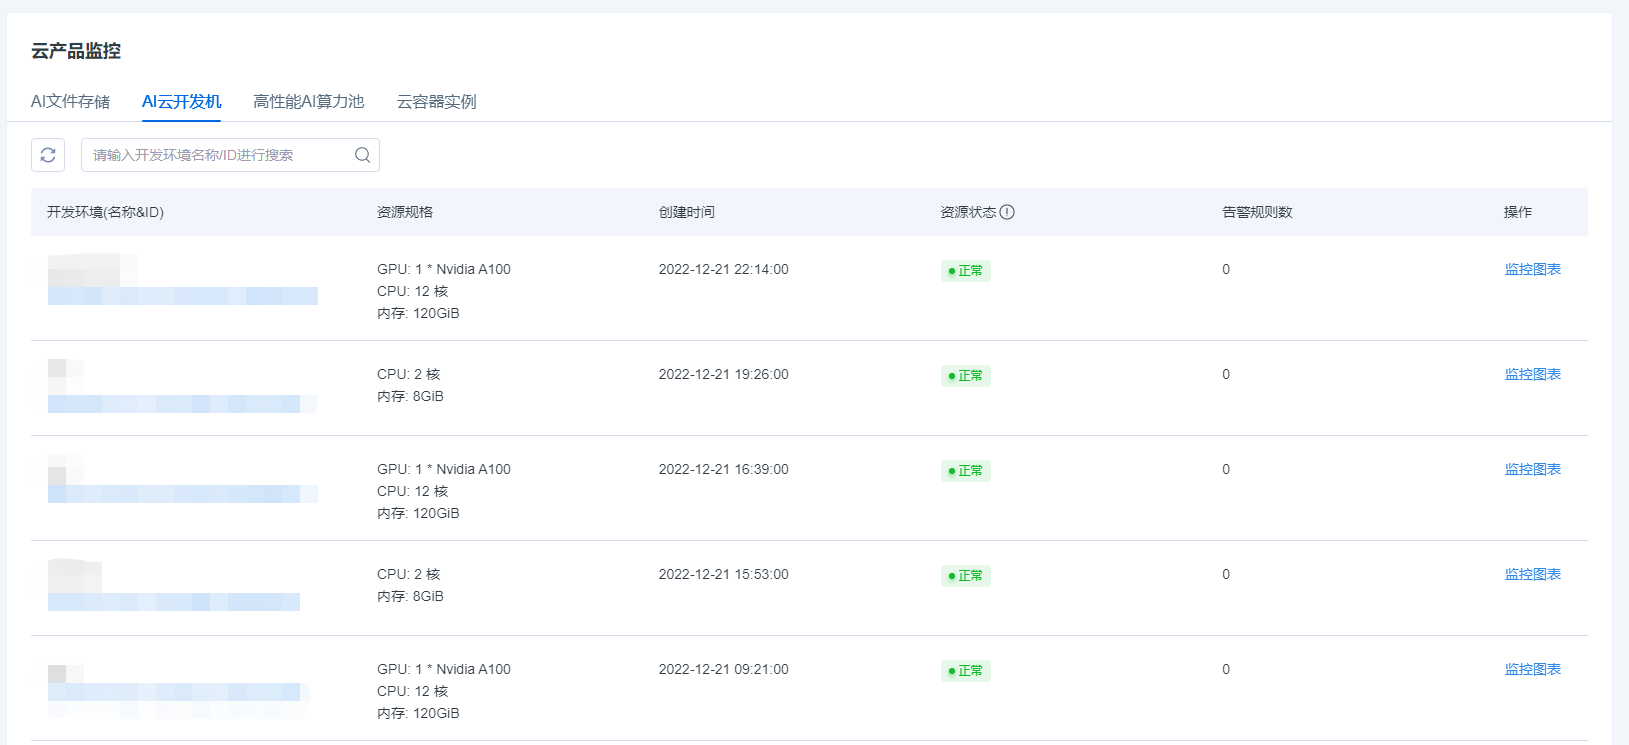
Cloud Product Monitoring Overview
Operating steps
- Log in to the cloud monitoring console.
- In the left navigation bar, select "Cloud Product Monitoring Overview".
- On the Cloud Product Monitoring page, click to select a cloud product name to switch the Tab page.
- On the Cloud Product Monitoring List page, you can view basic information such as resource specifications, creation time, resource status, and the number of alarm rules.
| Column Name | Meaning |
|---|---|
| Resource Name & ID | The name & ID of this resource |
| Resource Specification | The specification set when this resource was purchased |
| Creation Time | The time when this resource was created |
| Resource Status | Normal: No exception alarm in the resource instance recently Reminder: The resource instance has triggered an alarm in the last 24 h and has been restored Alarming: No exception alarm in the resource instance recently |
| Number of Alarm Rules | The number of alarm rules bound to this resource |
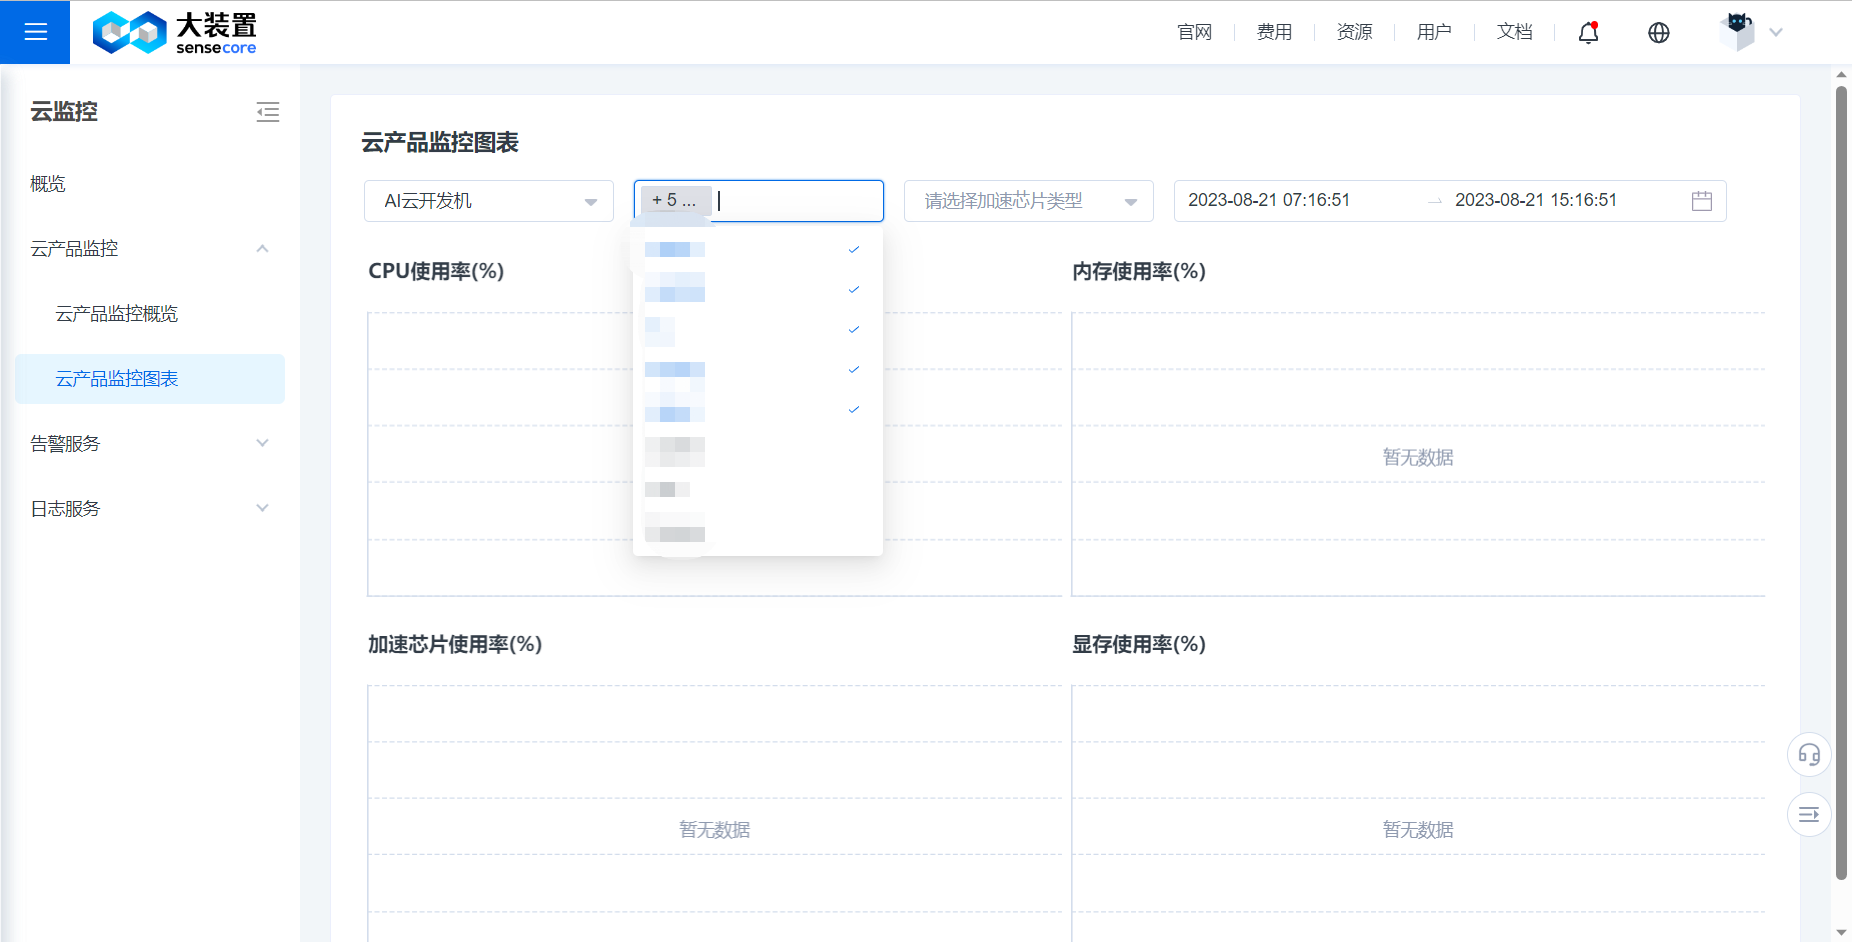
Cloud Product Monitoring Charts
Operating steps
- Log in to the cloud monitoring console.
- In the left navigation bar, select "Cloud Product Monitoring Chart".
- On the Cloud Product Monitoring page, click to select a cloud product name to switch the Tab page.
- You can view the details of resource metrics on the Cloud Product Monitoring List page. You can select multiple resource instances to aggregate resources and display metrics collectively.
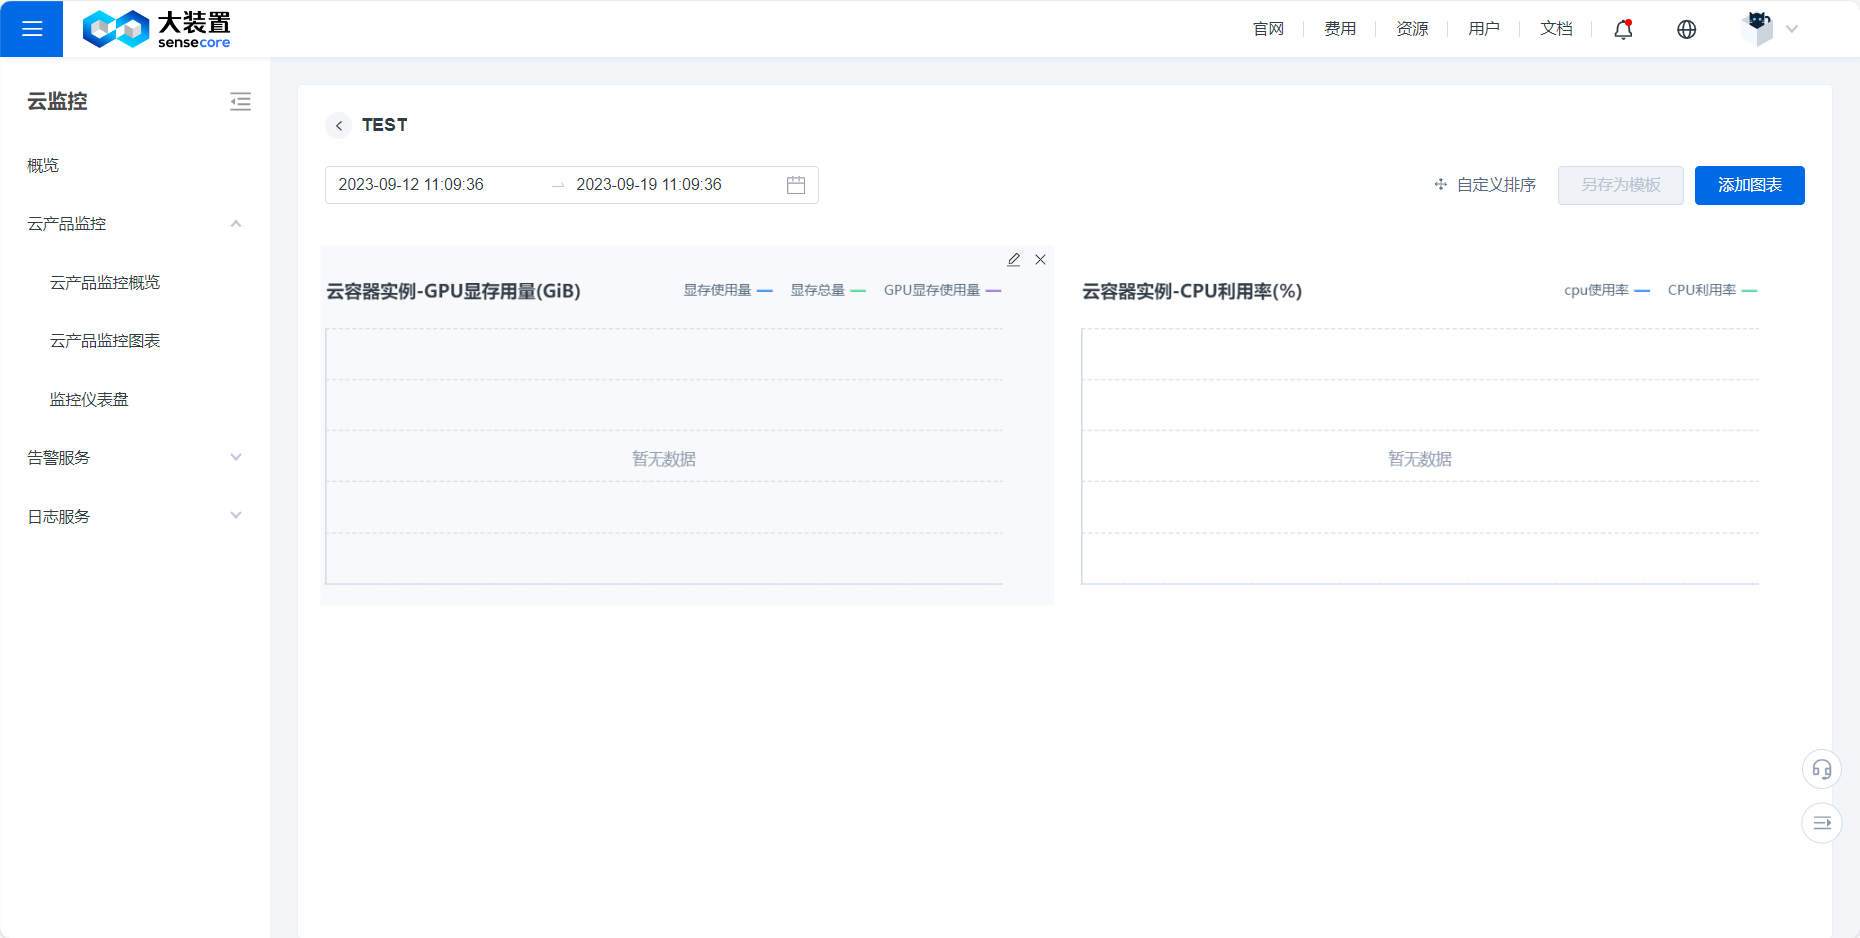
Monitoring Dashboard
Operating steps
- Log in to the cloud monitoring console.
- In the left navigation bar, select "Monitoring Dashboard".
- In the navigation bar on the Monitoring Dashboard screen, click and switch the Tab page to a management instance or management template.
- Click Create Dashboard and customize your own dashboard for cloud product resource monitoring by adding charts.
Create an Alarm Rule
Application Scenarios
You can define how the alarm system detects monitoring data by setting alarm rules, and an alarm notification will be triggered and sent when the data meets the defined alarm rules. The alarm service provides flexible and diverse alarm policies and timely message notifications, so that you can know and solve the problems in the first time when business exceptions occur.
Operating steps
- Log in to the cloud monitoring console.
- In the left navigation bar, select Alarm Service > Alarm Rule.
- On the Alarm Rule page, click Create Alarm Rule.
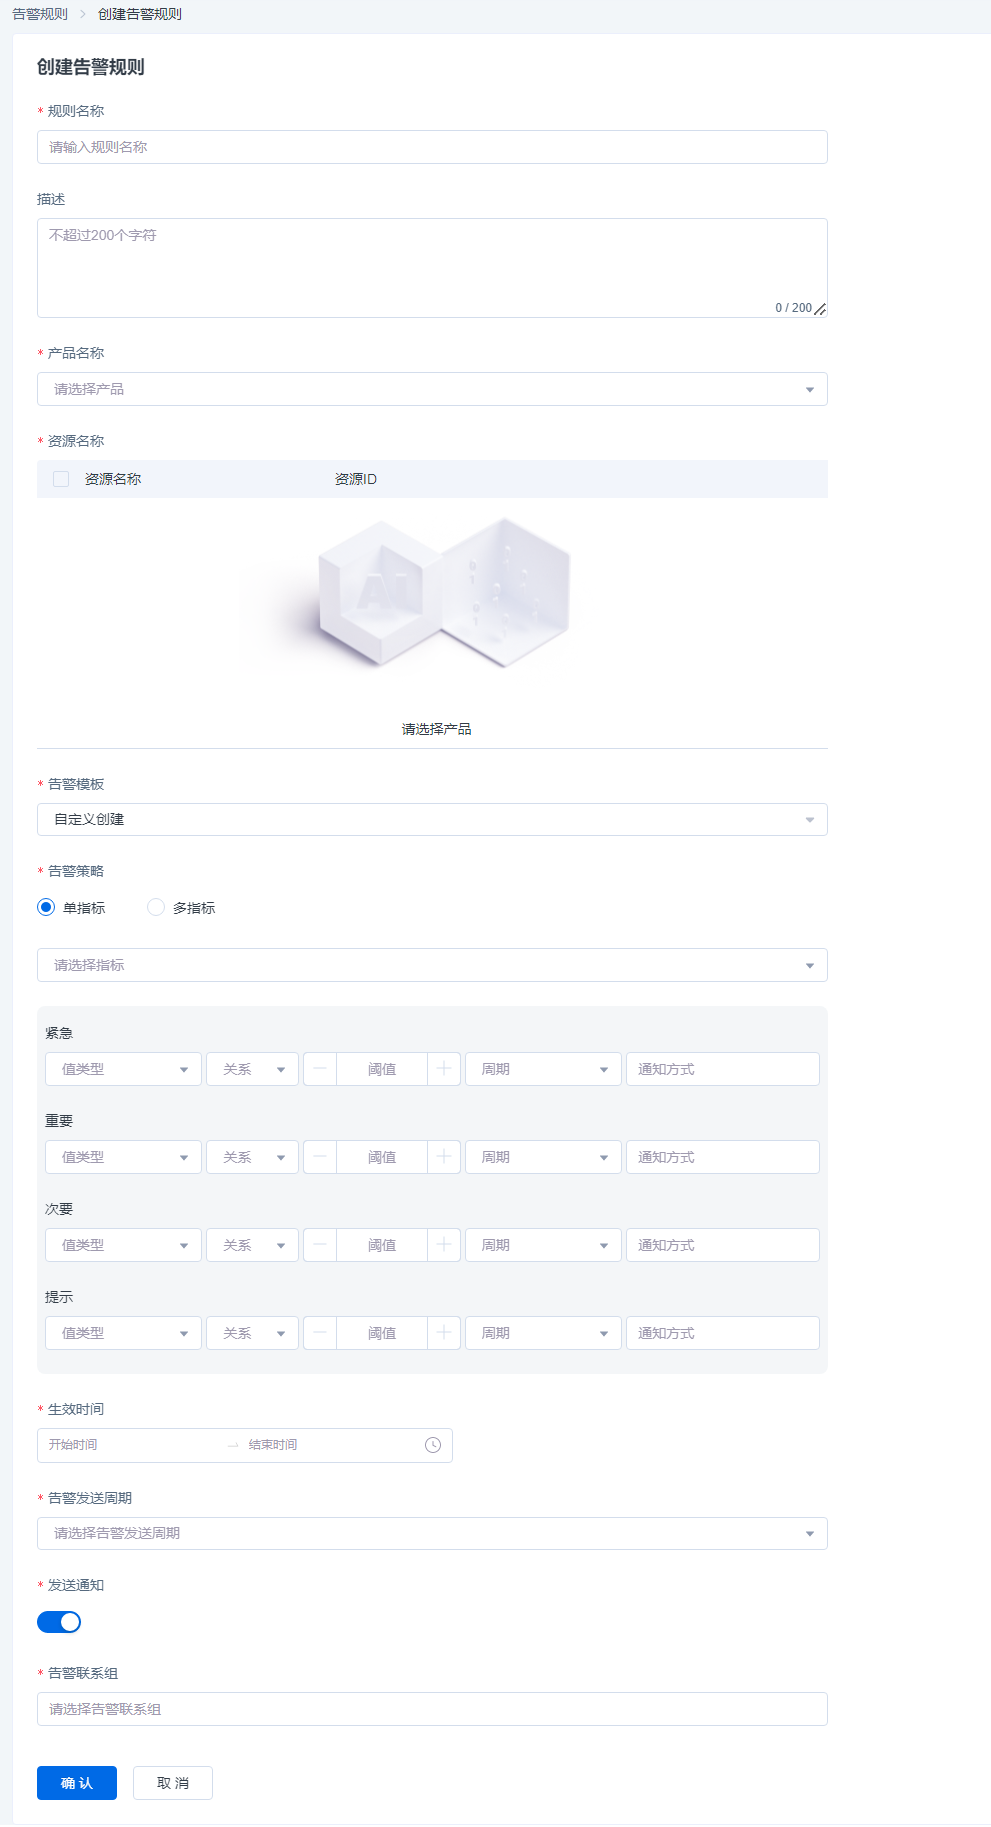
- On the Create Alarm Rule page, fill in the relevant content of the alarm rule.
- Click OK to complete the creation of the alarm rule.
| Parameter Type | Parameter | Parameter Description |
|---|---|---|
| Basic Info | Name | The name of the alarm rule, used to identify the alarm policy. |
| Description | Custom description of the alarm rule, descriptive information. | |
| Alarm Object | Product Name | The name of a cloud product that can be managed by CMS. |
| Resource Name | The resource scope that the alarm rule acts on. One or more effective resources can be selected. | |
| Alarm Rule | Metric Type | The alarm policy can be set through a single metric or multiple metrics. |
| Alarm Template | You can directly select the policy template created in the Alarm Template module, without the need of repeatedly filling in information such as alarm metrics and trigger conditions, or you can select a custom action. | |
| Alarm Metric | Monitoring resource metrics used to trigger an alarm. | |
| Trigger Condition | Set the monitoring metric value type, comparison relationship, threshold range, and duration that trigger an alarm. When the monitored resource metric reaches the trigger condition, the system will trigger an alarm message. If the metric type is set as single-metric, only one trigger condition is supported. If the metric type is set as multi-metric, one or more trigger conditions are supported. You can select alarm triggering when all metrics meet the condition (&&) or when only one metric meets the condition ( | |
| Alarm Level | It is used to define the severity of an alarm, and supports setting urgent, major, minor, and reminder levels. | |
| Effective Time | The effective time of an alarm policy. The alarm policy only monitors whether the resource data meets the trigger condition within the effective time. | |
| Alarm Sending Cycle | After an alarm policy is triggered, if the monitored resource continues to trigger alarms, the system will periodically send alarm notifications. | |
| Alarm Mode | Notification Mode | Select one or more channels, and currently support in-site messaging. |
| Alarm Contact Group | It is used to define the alarm contact group which needs to be notified after an alarm message is triggered, and one or more recipients can be selected. |
Query Log Information
Application Scenarios
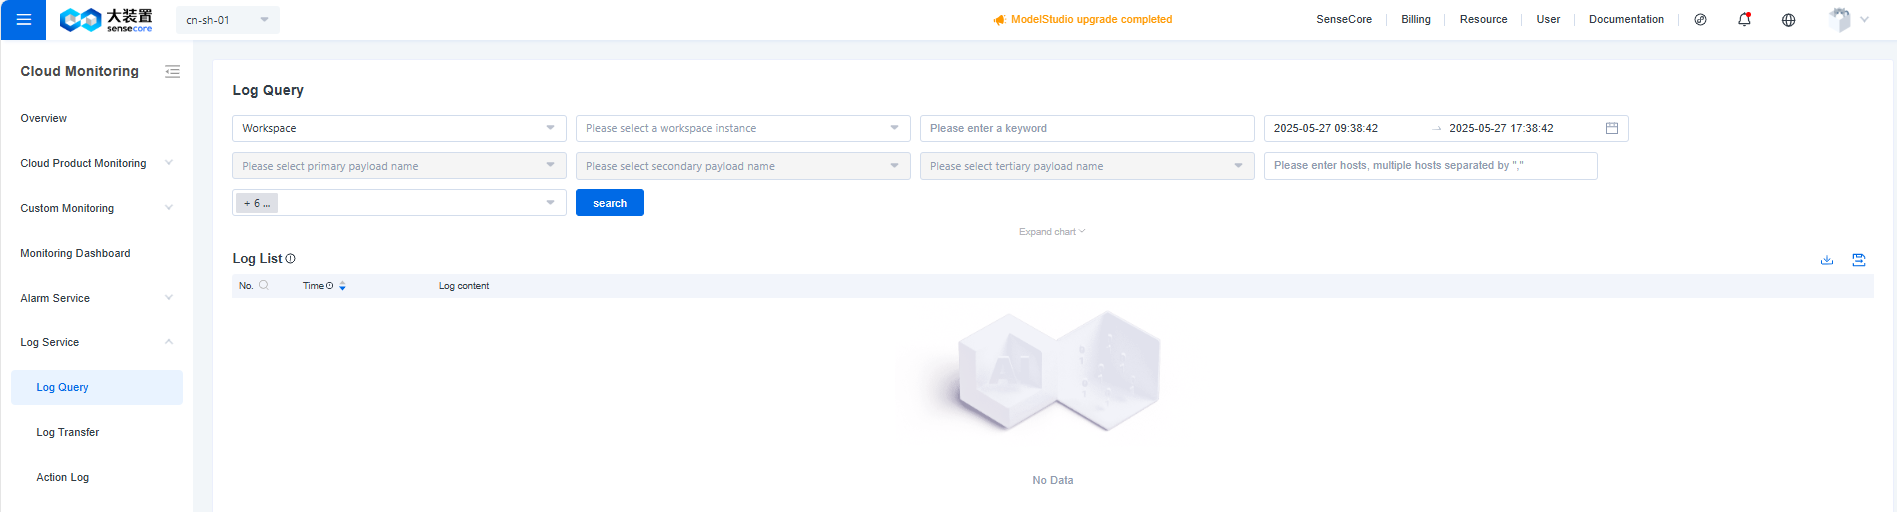
You can query the log information of cloud product resources in Log Service, filter the log information by cloud product name, date range, and log keywords, and finally view the required relevant log content.
Operating steps
- Log in to the cloud monitoring console.
- In the left navigation bar, select Log Service > Log Query.
- On the Log Query page, select the name of the sub-product whose logs need to be viewed.
- Click the Filter by Time box to select the log time range to be viewed.
- You can choose to further enter Host information or enter the keyword of the log to be viewed for more accurate select.
- View the log information related to the sub-product to be viewed in the list, including time and log content.
- Click Export log to export to Object Storage and download.
| Column Name | Meaning |
|---|---|
| Cloud Product Name | Select the cloud product whose logs need to be viewed |
| Resource Instance | Select the resource instance whose logs need to be viewed |
| Custom Filter | Different custom filter conditions can be added to resource instances of different cloud products |
| Search by Keyword | In the search box, enter the keyword of the log to be viewed and make confirmation |
| Filter by Time | Click the Filter by Time box to select the log time range to be viewed |
| Search by Host | In the search box, enter the Host information of the log to be viewed |
Custom Metric Upload
Application Scenarios
You can upload custom metric data by using OpenTelemetry SDK
Prerequisites
Obtain the authentication token and access point information on the console
View the token information and access point endpoint of the monitoring warehouse
Report directly
Configuration (can also be specified in the sdk)
Access point settings
export OTEL_EXPORTER_OTLP_METRICS_ENDPOINT="https://monitor-internal-ingestion.cn-sh-01.sensecore.cn/v1/telemetry-repos/${telemetry-repo-id}/metric/upload"
token settings
export OTEL_EXPORTER_OTLP_METRICS_HEADERS="Authorization=Bearer ${token}"
SDK upload (golang)
Prerequisites
Ensure that you have the following installed locally:
Go 1.22 or greater
Add Dependencies
Install the following packages:
go.opentelemetry.io/contrib/instrumentation/net/http/otelhttp v0.48.0
go.opentelemetry.io/otel v1.26.0
go.opentelemetry.io/otel/exporters/otlp/otlpmetric/otlpmetrichttp v1.26.0
go.opentelemetry.io/otel/metric v1.26.0
go.opentelemetry.io/otel/sdk v1.26.0
go.opentelemetry.io/otel/sdk/metric v1.26.0
Initialize the OpenTelemetry SDK
package main

import (
    "context"
    "errors"
    "go.opentelemetry.io/otel/exporters/otlp/otlpmetric/otlpmetrichttp"
    "log"
    "sync"
    "time"

    "go.opentelemetry.io/otel"
    "go.opentelemetry.io/otel/propagation"
    "go.opentelemetry.io/otel/sdk/metric"
    sdkmetric "go.opentelemetry.io/otel/sdk/metric"
    sdkresource "go.opentelemetry.io/otel/sdk/resource"
)

// setupOTelSDK bootstraps the OpenTelemetry pipeline.
// If it does not return an error, make sure to call shutdown for proper cleanup.
func setupOTelSDK(ctx context.Context) (shutdown func(context.Context) error, err error) {
    var shutdownFuncs []func(context.Context) error

    // shutdown calls cleanup functions registered via shutdownFuncs.
    // The errors from the calls are joined.
    // Each registered cleanup will be invoked once.
    shutdown = func(ctx context.Context) error {
        var err error
        for _, fn := range shutdownFuncs {
            err = errors.Join(err, fn(ctx))
        }
        shutdownFuncs = nil
        return err
    }

    // handleErr calls shutdown for cleanup and makes sure that all errors are returned.
    handleErr := func(inErr error) {
        err = errors.Join(inErr, shutdown(ctx))
    }

    // Set up propagator.
    prop := newPropagator()
    otel.SetTextMapPropagator(prop)

    // Set up meter provider.
    meterProvider, err := initMeterProvider()
    if err != nil {
        handleErr(err)
        return
    }
    shutdownFuncs = append(shutdownFuncs, meterProvider.Shutdown)
    otel.SetMeterProvider(meterProvider)

    return
}

func newPropagator() propagation.TextMapPropagator {
    return propagation.NewCompositeTextMapPropagator(
        propagation.TraceContext{},
        propagation.Baggage{},
    )
}

func initMeterProvider() (*sdkmetric.MeterProvider, error) {
    ctx := context.Background()

    exporter, err := otlpmetrichttp.New(ctx)
    if err != nil {
        log.Fatalf("new otlp metric grpc exporter failed: %v", err)
    }

    mp := sdkmetric.NewMeterProvider(
        sdkmetric.WithReader(sdkmetric.NewPeriodicReader(exporter, metric.WithInterval(3*time.Second))),
        sdkmetric.WithResource(nil),
    )

    otel.SetMeterProvider(mp)
    return mp, nil
}
Instrument the HTTP server
Now that we have the OpenTelemetry SDK initialized, we can instrument the HTTP server.
Modify main.go to include code that sets up OpenTelemetry SDK and instruments the HTTP server using the otelhttp instrumentation library:
package main

import (
    "context"
    "errors"
    "log"
    "net"
    "net/http"
    "os"
    "os/signal"
    "time"

    "go.opentelemetry.io/contrib/instrumentation/net/http/otelhttp"
)

func main() {
    if err := run(); err != nil {
        log.Fatalln(err)
    }
}

func run() (err error) {
    // Handle SIGINT (CTRL+C) gracefully.
    ctx, stop := signal.NotifyContext(context.Background(), os.Interrupt)
    defer stop()

    // Set up OpenTelemetry.
    otelShutdown, err := setupOTelSDK(ctx)
    if err != nil {
        return
    }
    // Handle shutdown properly so nothing leaks.
    defer func() {
        err = errors.Join(err, otelShutdown(context.Background()))
    }()

    // Start HTTP server.
    srv := &http.Server{
        Addr:         ":8080",
        BaseContext:  func(_ net.Listener) context.Context { return ctx },
        ReadTimeout:  time.Second,
        WriteTimeout: 10 * time.Second,
        Handler:      newHTTPHandler(),
    }
    srvErr := make(chan error, 1)
    go func() {
        srvErr <- srv.ListenAndServe()
    }()

    // Wait for interruption.
    select {
    case err = <-srvErr:
        // Error when starting HTTP server.
        return
    case <-ctx.Done():
        // Wait for first CTRL+C.
        // Stop receiving signal notifications as soon as possible.
        stop()
    }

    // When Shutdown is called, ListenAndServe immediately returns ErrServerClosed.
    err = srv.Shutdown(context.Background())
    return
}

func newHTTPHandler() http.Handler {
    mux := http.NewServeMux()

    // handleFunc is a replacement for mux.HandleFunc
    // which enriches the handler's HTTP instrumentation with the pattern as the http.route.
    handleFunc := func(pattern string, handlerFunc func(http.ResponseWriter, *http.Request)) {
        // Configure the "http.route" for the HTTP instrumentation.
        handler := otelhttp.WithRouteTag(pattern, http.HandlerFunc(handlerFunc))
        mux.Handle(pattern, handler)
    }

    // Register handlers.
    handleFunc("/hello", rolldice)

    // Add HTTP instrumentation for the whole server.
    handler := otelhttp.NewHandler(mux, "/")

    return handler
}
Add Custom Instrumentation
Instrumentation libraries capture telemetry at the edges of your systems, such as inbound and outbound HTTP requests, but they don’t capture what’s going on in your application. For that you’ll need to write some custom manual instrumentation.
Modify rolldice.go to include custom instrumentation using OpenTelemetry API:
package main

import (
    "context"
    "io"
    "log"
    "math/rand"
    "net/http"
    "strconv"

    "go.opentelemetry.io/otel/metric"

    "go.opentelemetry.io/otel"
    "go.opentelemetry.io/otel/attribute"
)

var (
    meter   = otel.Meter("test001")
    rollCnt metric.Int64Counter
)

func init() {
    var err error
    rollCnt, err = meter.Int64Counter("test001.xx",
        metric.WithDescription("The number of rolls by roll value"),
        metric.WithUnit("{roll}"))
    if err != nil {
        panic(err)
    }
}

func rolldice(w http.ResponseWriter, r *http.Request) {
    roll := 1 + rand.Intn(6)

    rollValueAttr := attribute.Int("roll.value", roll)
    rollCnt.Add(context.Background(), 1, metric.WithAttributes(rollValueAttr))

    resp := strconv.Itoa(roll) + "\n"
    if _, err := io.WriteString(w, resp); err != nil {
        log.Printf("Write failed: %v\n", err)
    }
}
Operation Guide
Custom Monitoring
View Monitoring Repository List
Apllication Scenarios
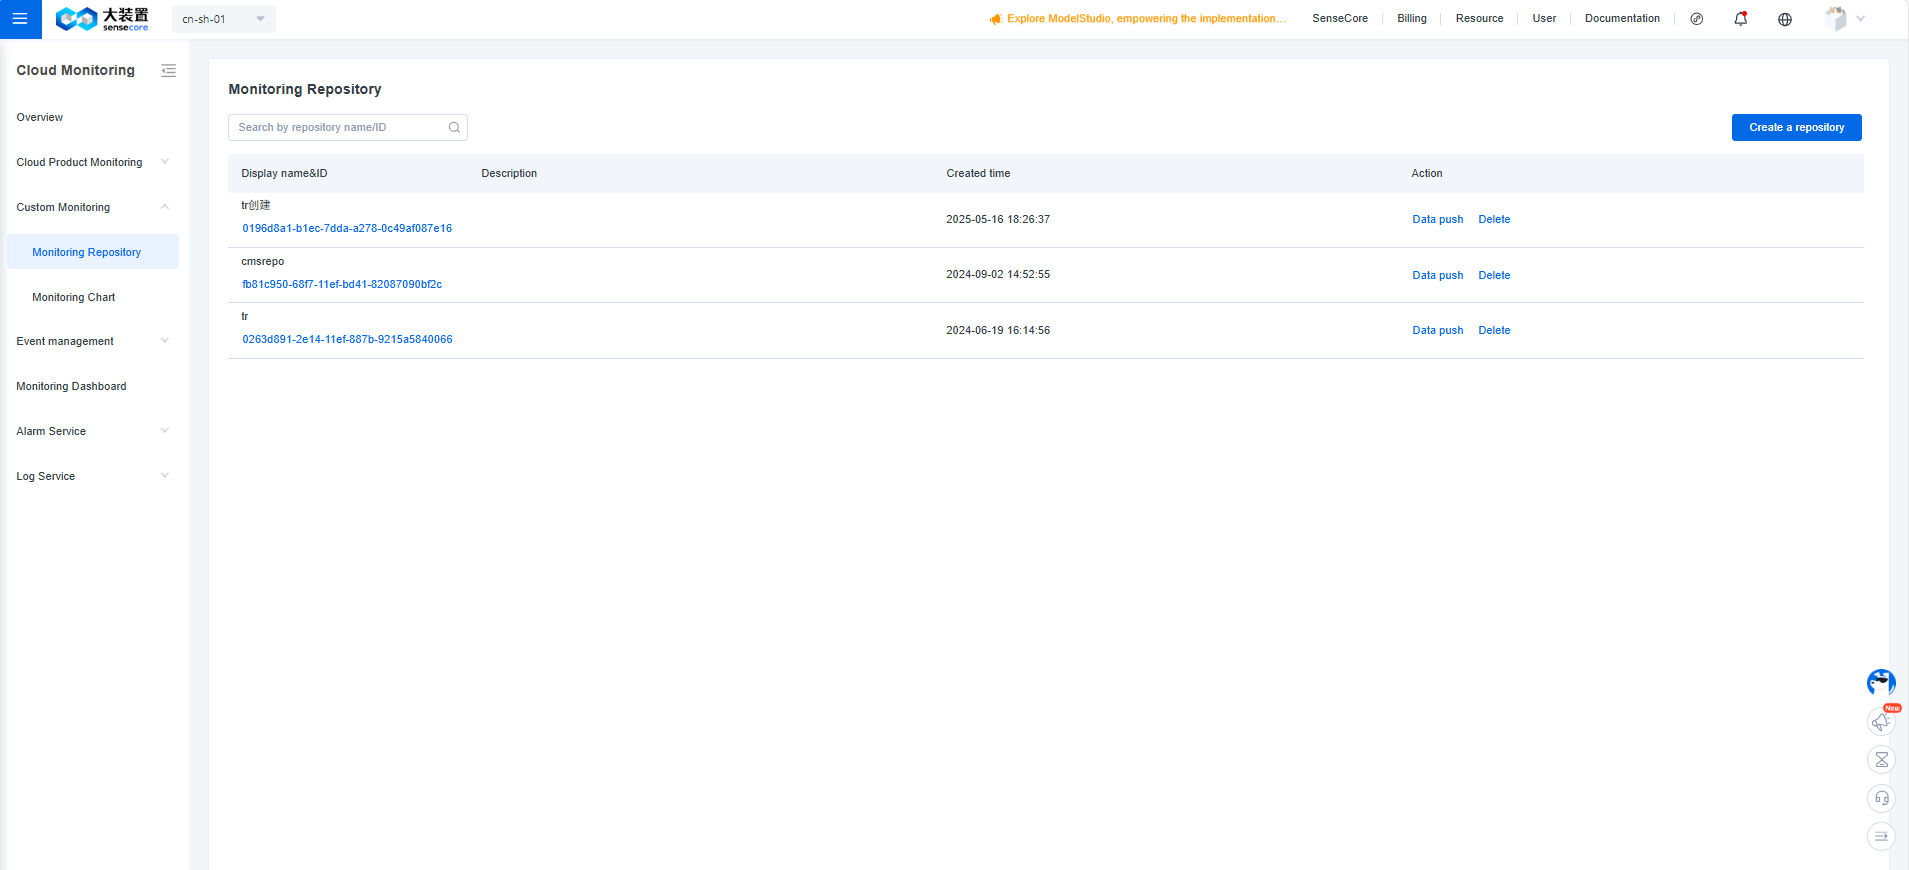
You can view information related to monitoring repositories through the Monitoring Repository List.
Operation Steps
- Log in to the cloud monitoring console.
- In the left navigation bar, select Custom Monitoring > Monitoring Repository.
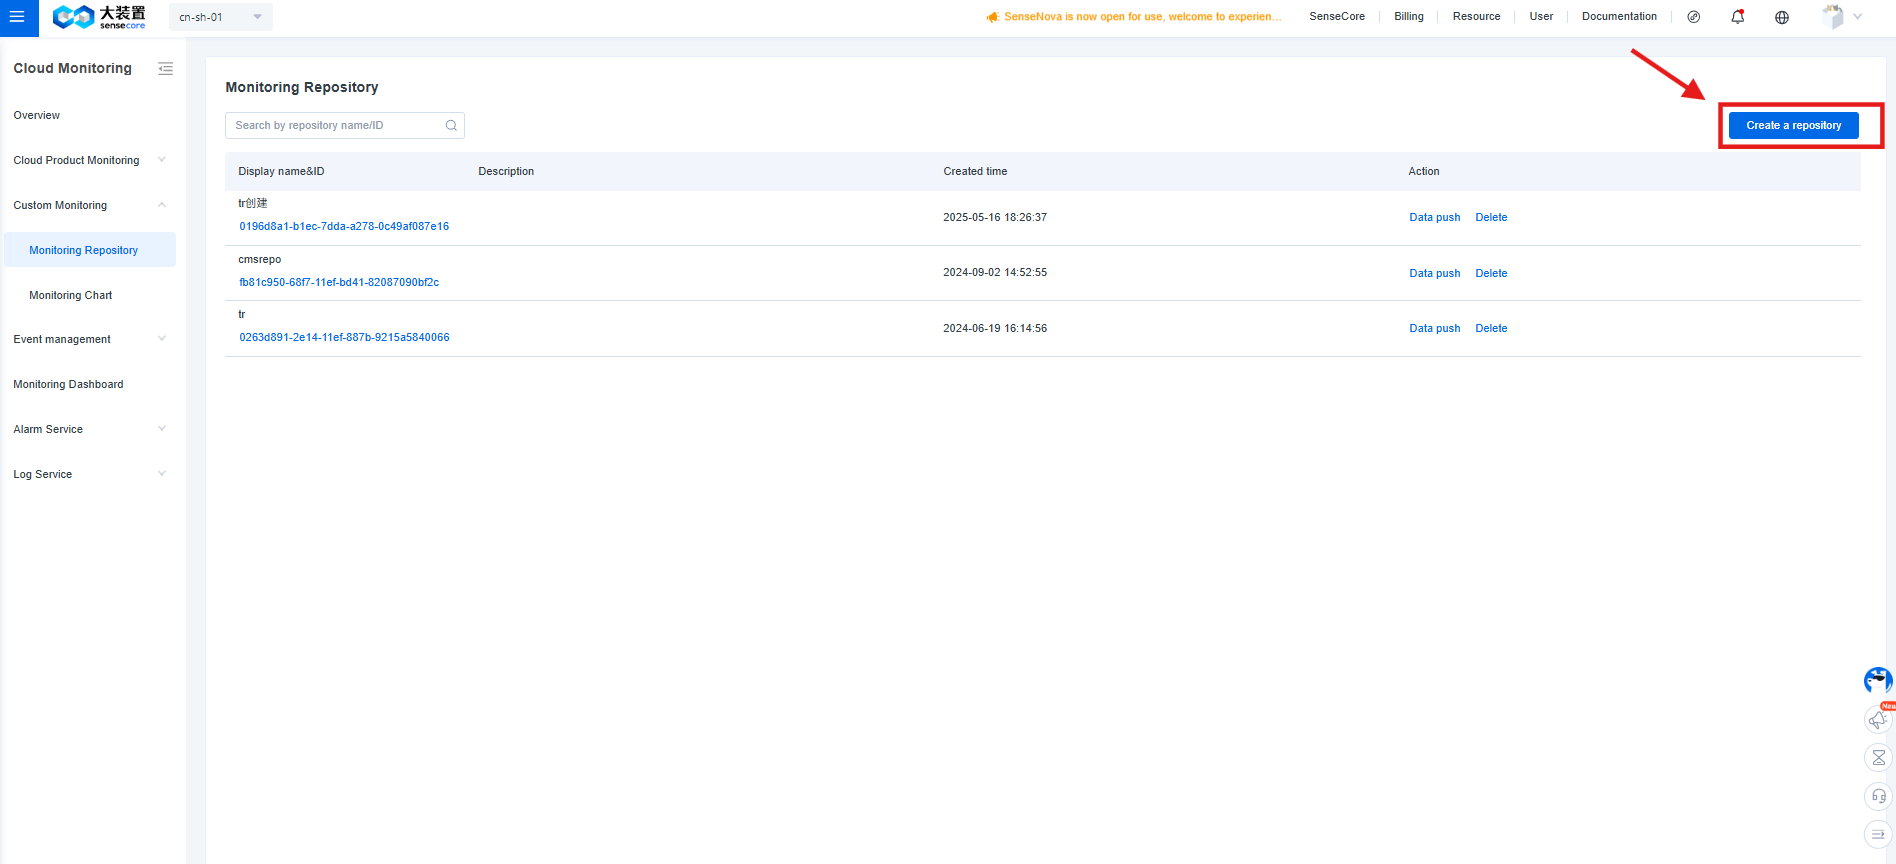
- On the Monitoring Repository page, you can view all monitoring repositories and their related information.
View Monitoring Repository Token and Endpoint Information
Application Scenarios
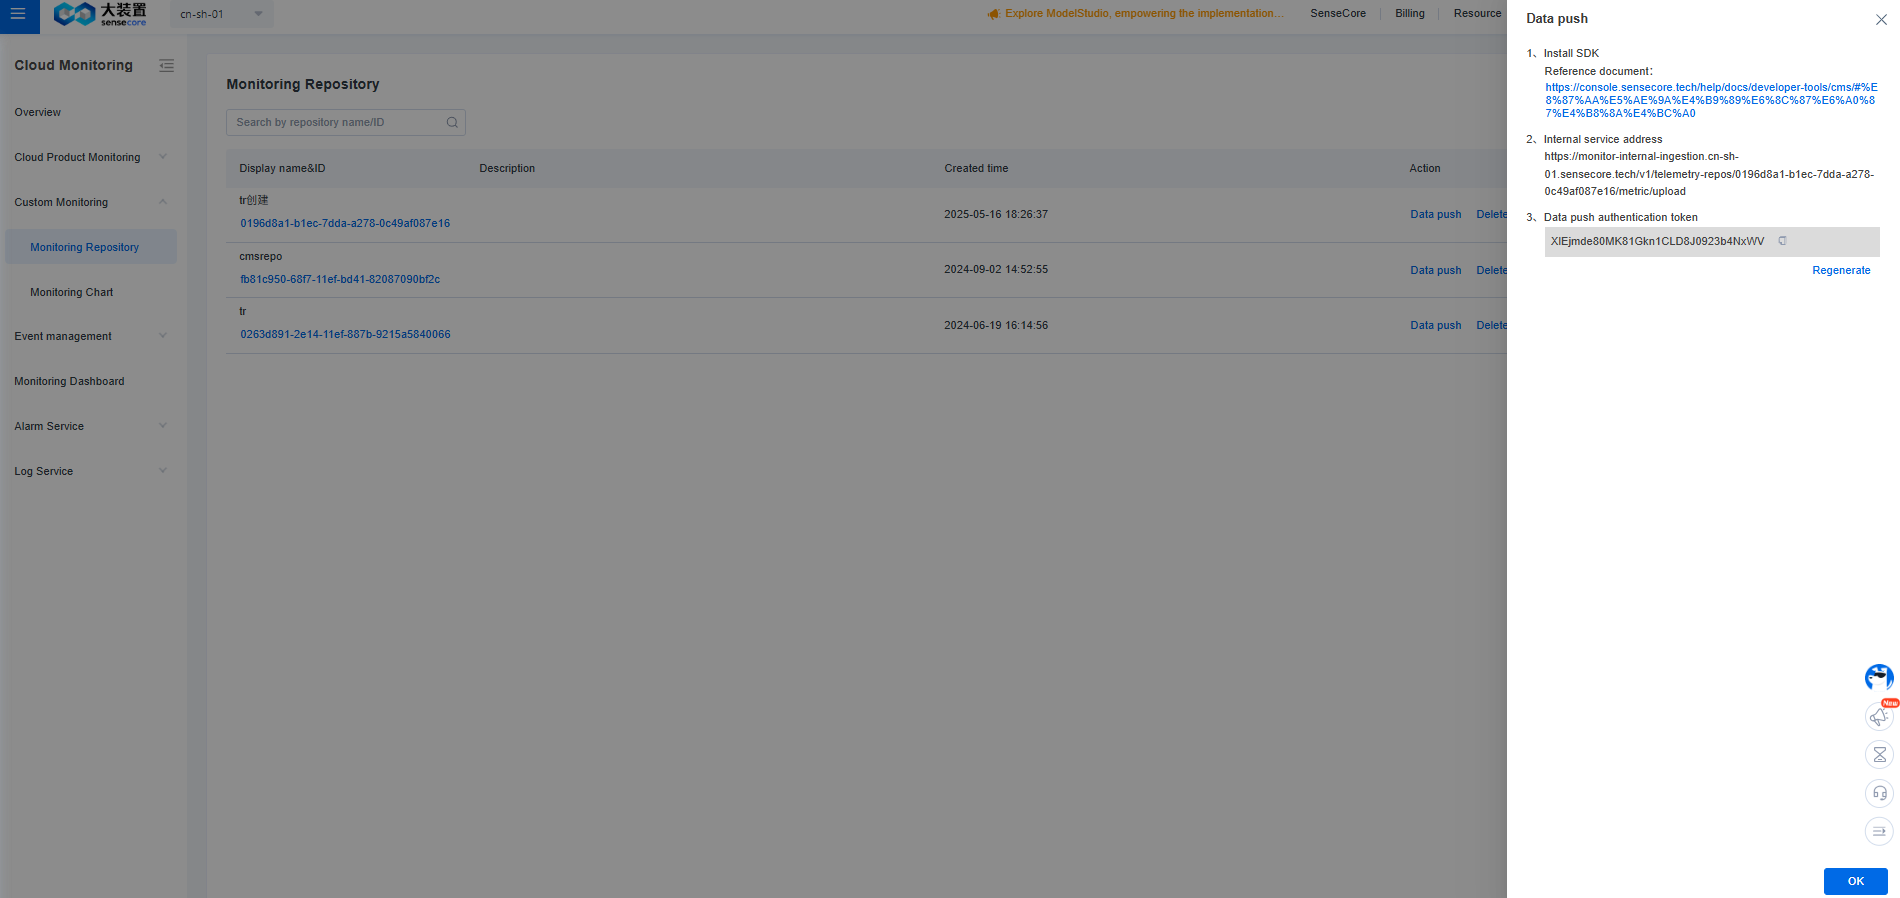
To report custom monitoring metrics, you must first obtain the token and endpoint information associated with the corresponding monitoring repository.
Operation Steps
- Log in to the cloud monitoring console.
- In the left navigation bar, select Custom Monitoring > Monitoring Repository.
- On the Monitoring Repository page, click [Data Push] in the corresponding row of the target repository to obtain the data reporting information.
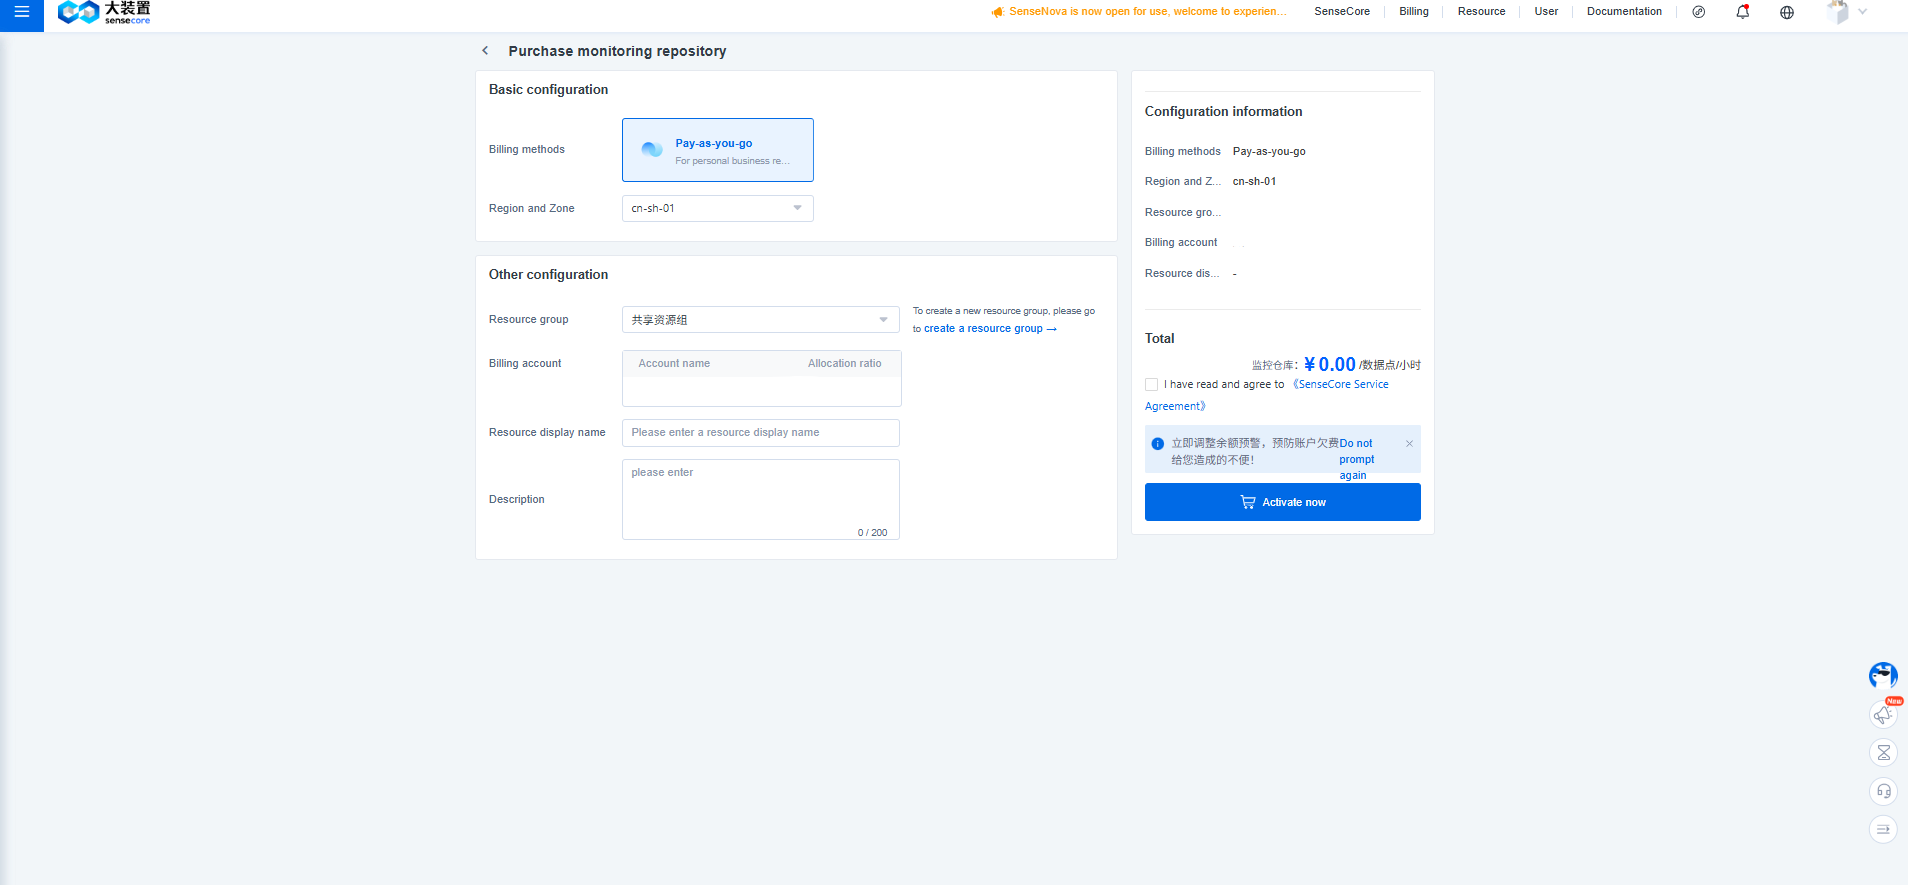
Creat Monitoring Repository
Application Scenarios Before reporting custom monitoring metric data, you need to create a monitoring repository to manage these metrics.
Operation Steps
- Log in to the cloud monitoring console.
- In the left navigation bar, select Custom Monitoring > Monitoring Repository.
- Clik [Creat a repository] and fill information to creat a repository.
- Create a monitoring repository.
Delete a Monitoring Repository
Application Scenarios
When a monitoring repository is no longer needed, you can delete it. However, repositories that have received data reports within the past week cannot be deleted.
Operation Steps
- Log in to the cloud monitoring console.
- In the left navigation bar, select Custom Monitoring > Monitoring Repository.
- On the Monitoring Repository page, click [Delete] in the corresponding row of the target repository to obtain the data reporting information.
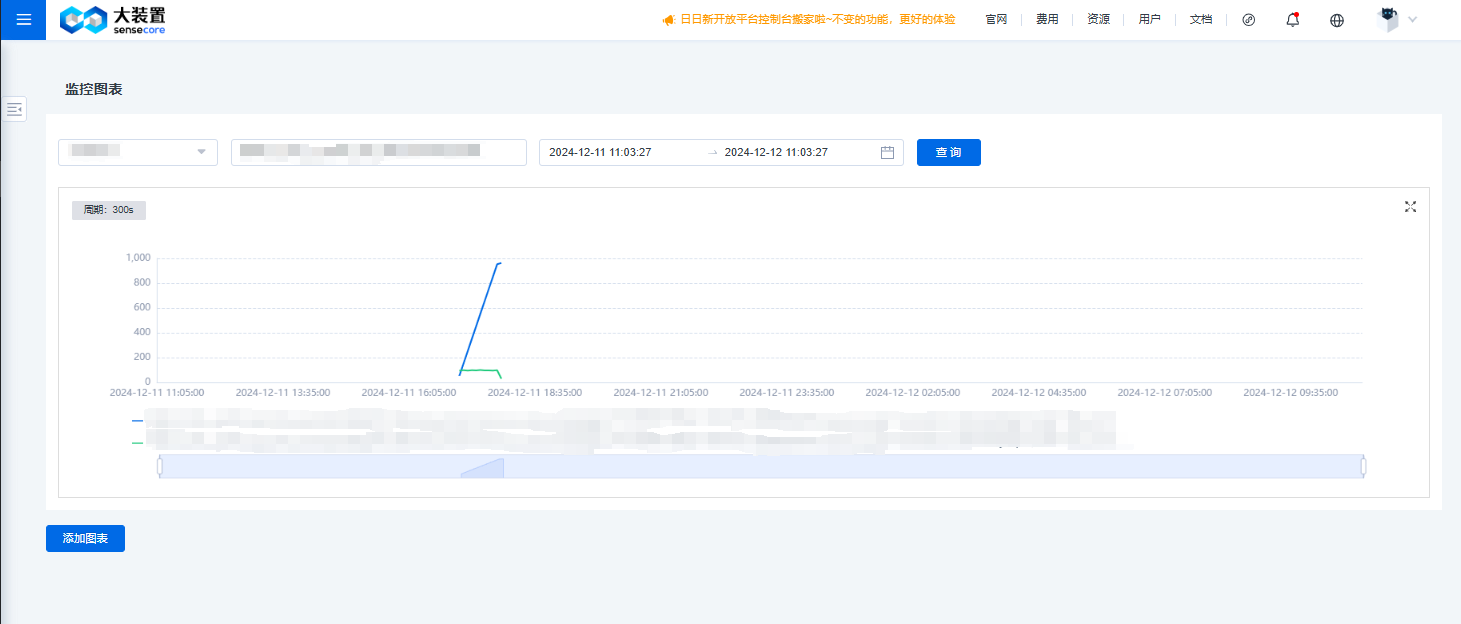
Monitoring Chart
Operation Steps
- Log in to the cloud monitoring console.
- In the left navigation bar, select Custom Monitoring > Monitoring Chart.
- On the Custom Monitoring Charts page, select a monitoring repository and enter the metric query expression.
- Click Query to view the corresponding metric chart data.
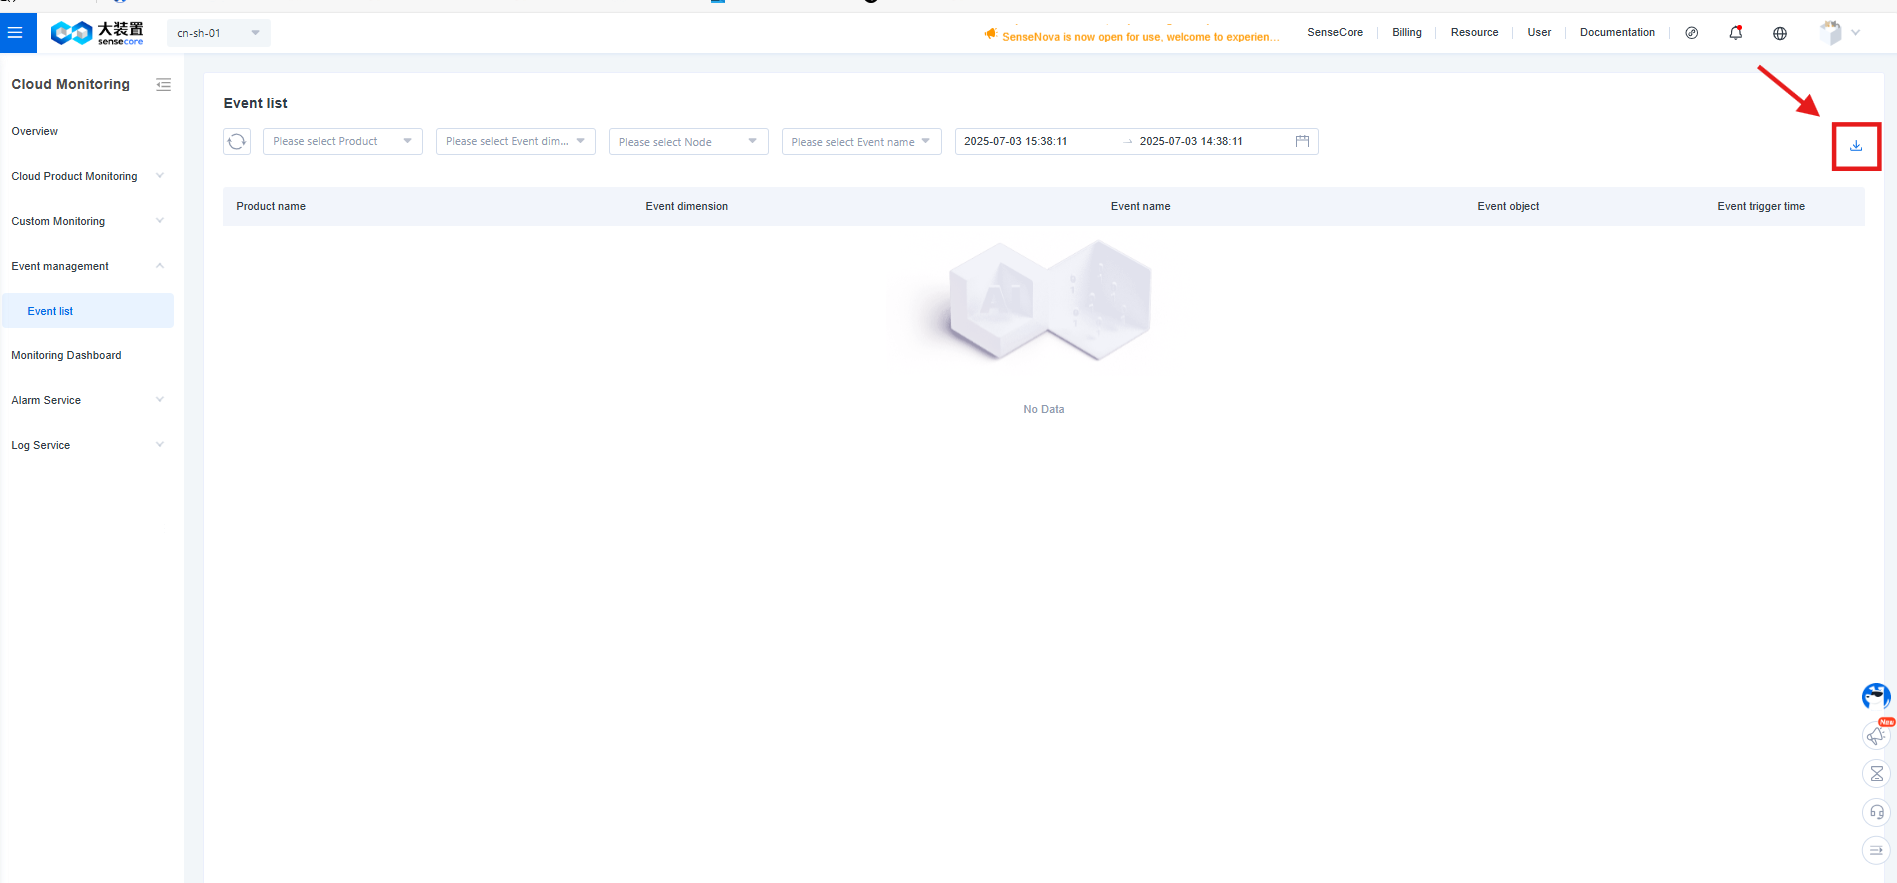
Event List
In the Event List, you can filter and view historical event records as needed. You can export event data based on the current filter conditions for further analysis and archiving.
Operation Steps
- Log in to the cloud monitoring console.
- In the left navigation bar, select Event Management > Event List.
- Based on your needs, select the Product, Event Dimension, Event Object, and Time Range to filter the events.
You can view events' history for up to 20 event objects at the same time.
- Further filter events by specifying the Event Name, if needed.
- Click the Download icon in the upper-right corner of the page to export the event data under the current filter conditions.
Alarm List
View Alarm History
Application Scenarios
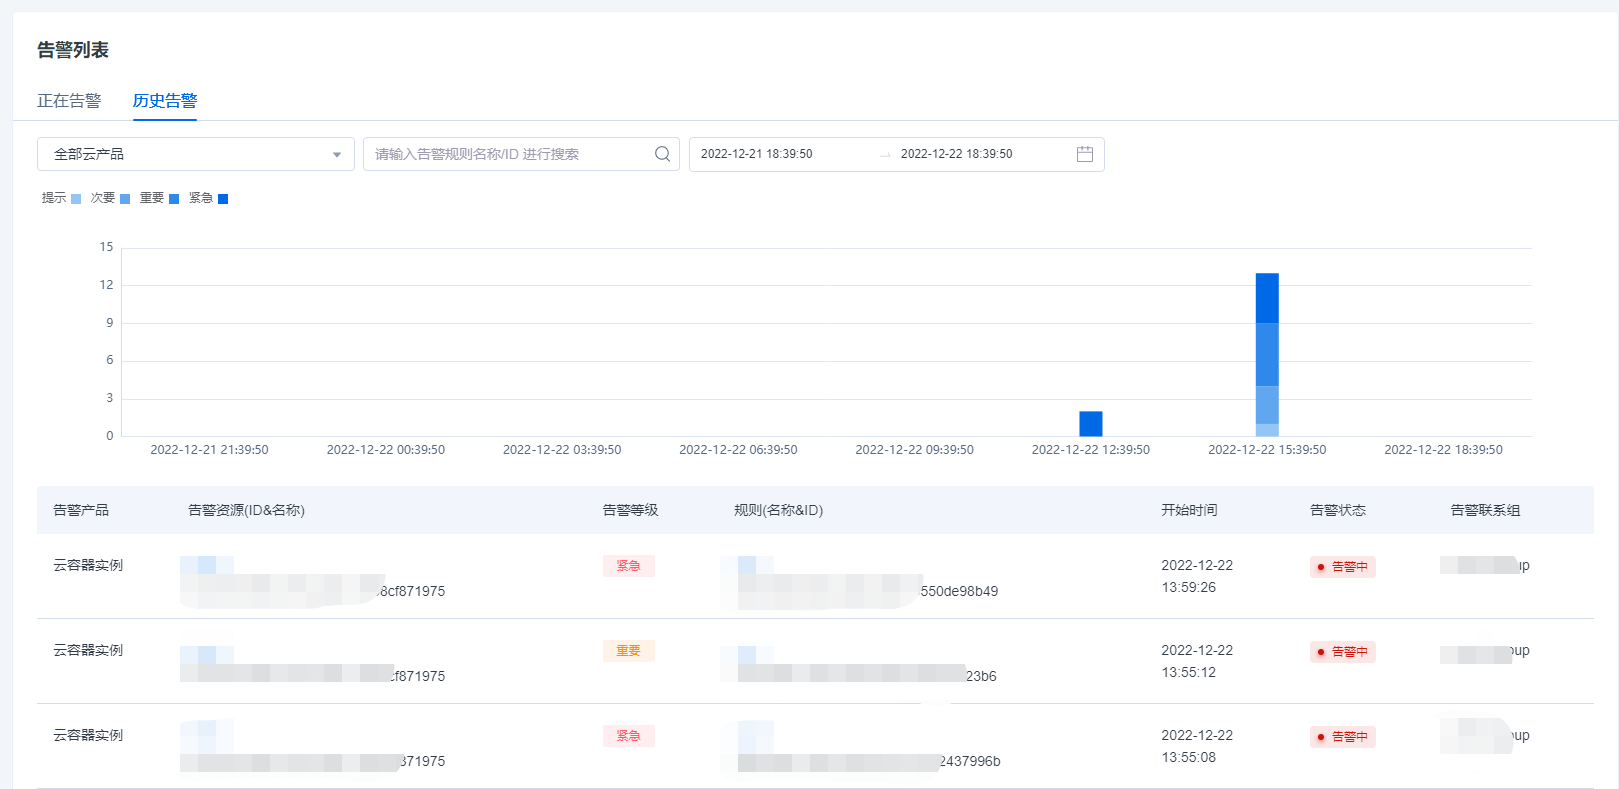
The Alarm History will record the automatically generated alarm history after an cloud product resource triggers an alarm, including key information such as the name of the faulty resource, alarm triggering time, duration, and alarm level, so that you can trace and view the alarm records when needed.
Operating Steps
- Log in to the cloud monitoring console.
- In the left navigation bar, select Alarm Service > Alarm List > Alarm History.
- On the Alarm History page, select the name of the sub-product whose alarm messages need to be viewed.
- Click the Filter by Time box to select the alarm message time range to be viewed.
- The items in the Alarm History List and their meanings are as follows:
| Column Name | Meaning |
|---|---|
| Alarm Product | The name of the cloud product that triggered the alarm message |
| Alarm Resource (ID & Name) | The name of the resource that triggered the alarm |
| Alarm Level | The severity of the alarm message |
| Rule (ID & Name) | The name of the alarm rule |
| Start Time | The time when the alarm was generated after the alarm message was triggered |
| Alarm State | The state of the alarm message, which is divided into the following four states • Alarming: still at the trigger threshold, synchronously displayed in the Alarming List • Normal: not at the trigger threshold, recovered • Insufficient data: no monitoring data for three consecutive hours • Disabled: displayed when the alarm rule is disabled |
| Alarm Contact Group | The notification contact group for alarm messages, defined in the alarm notification |
View an Alarming Message
Application Scenarios
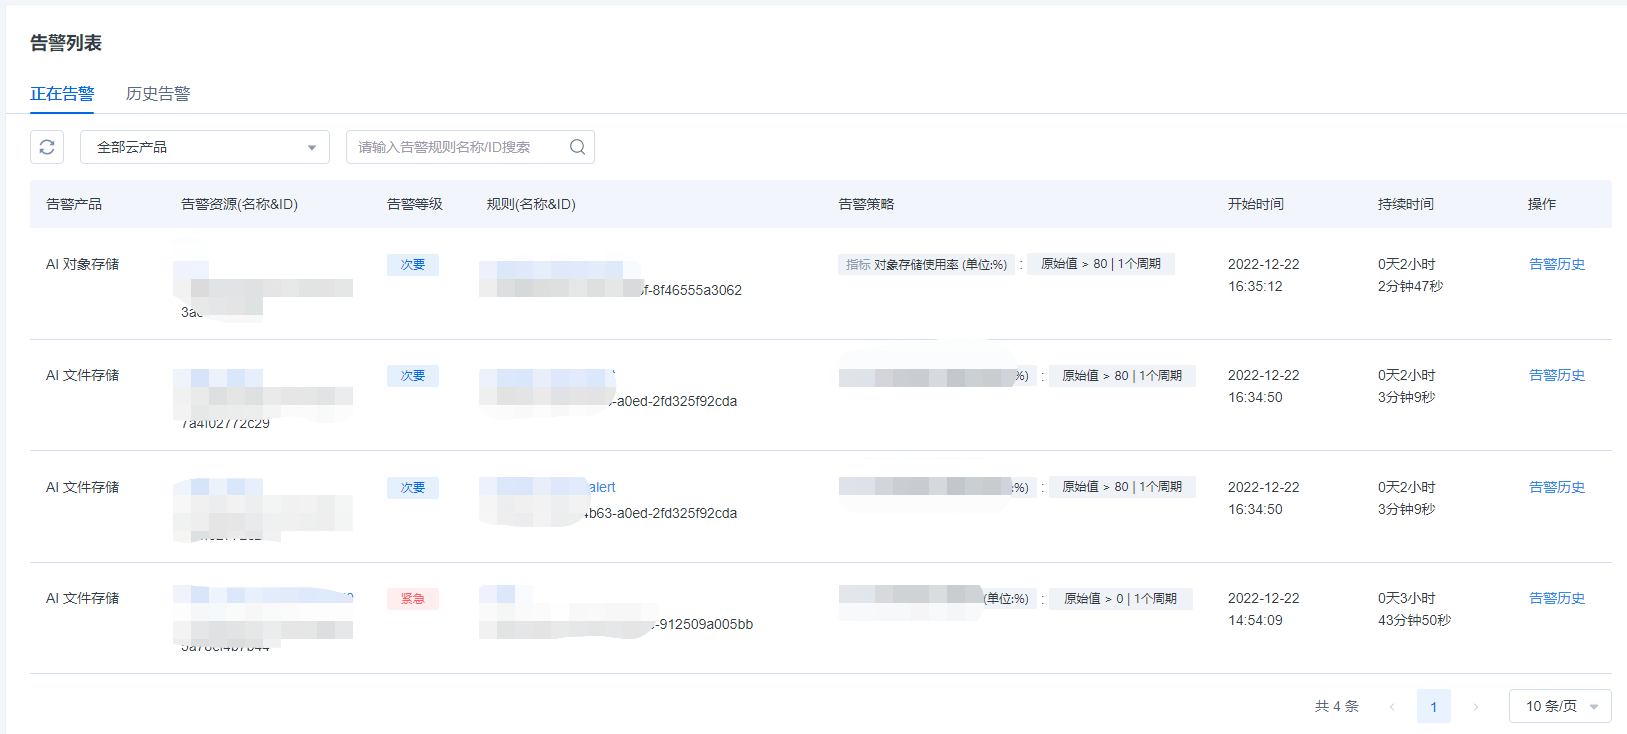
Users can view the detailed information of an alarm that is being triggered in real time, such as resource alarm messages and alarm rules, start time, and duration.
Operating steps
- Log in to the cloud monitoring console.
- In the left navigation bar, select Alarm Service > Alarm List > Alarming.
- On the Alarming page, select the name of the sub-product whose alarm messages need to be viewed.
- The items in the Alarming List and their meanings are as follows:
| Column Name | Meaning |
|---|---|
| Alarm Product | The name of the cloud product that triggered the alarm message |
| Alarm Resource (ID & Name) | The name of the resource that triggered the alarm |
| Alarm Level | The name of the resource that triggers the alarm |
| Rule (ID & Name) | The name of the resource that triggers the alarm |
| Alarm Policy | The policy content that triggers the alarm rule |
| Start Time | The time when the alarm was generated after the alarm message was triggered |
| Duration | The duration since the alarm message was triggered |
Alarm Rule
View an Alarm Rule
Application Scenarios
You can view existing alarm rules and their detailed information through the Alarm Service in CMS.
Operating steps
- Log in to the cloud monitoring console.
- In the left navigation bar, select Alarm Service > Alarm Rule.
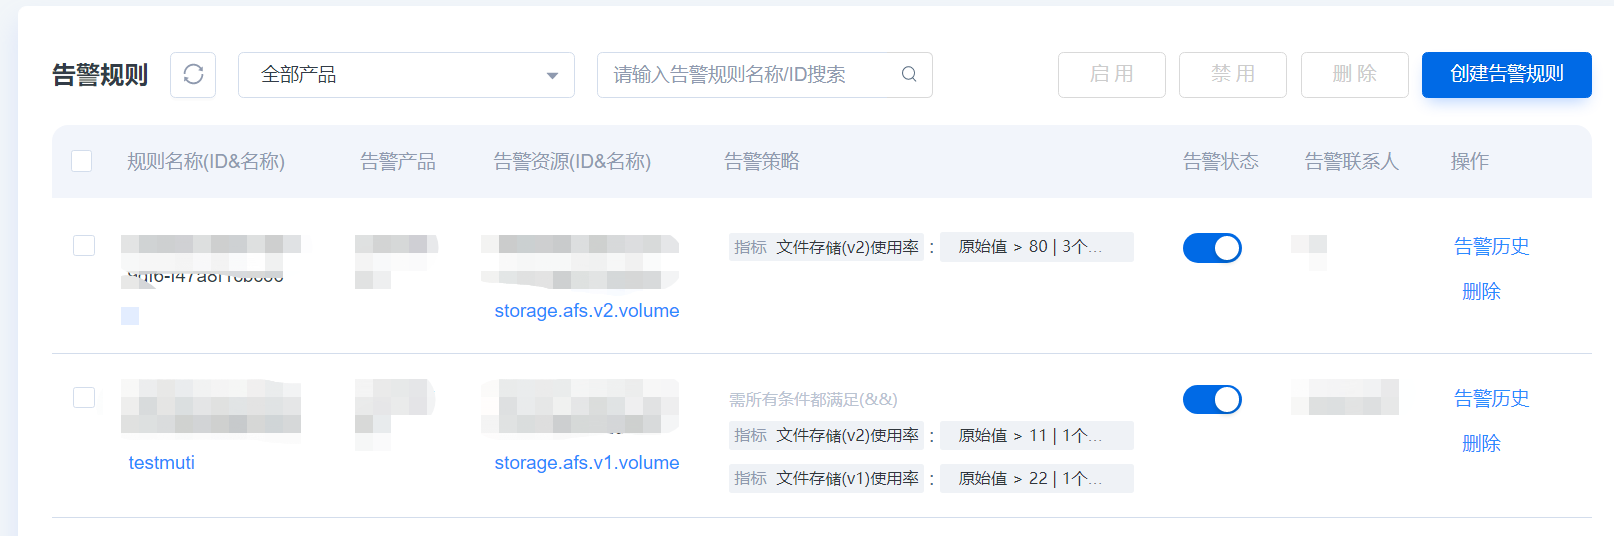
- On the Alarm Rule page, you can view the detailed information of the specified alarm rule. The items in the Alarm Rule List and their meanings are as follows:
| Column Name | Meaning |
|---|---|
| Rule Name (ID & Name) | The name of the resource that triggers the alarm |
| Alarm Product | The name of the cloud product that triggered the alarm message |
| Alarm Resource (ID & Name) | The name of the resource that triggered the alarm |
| Alarm Policy | The policy content that triggers the alarm rule |
| Alarm State | The state of the alarm rule: enabled or disabled |
| Alarm Contact Group | The alarm contact group to be notified by the alarm rule, defined in the alarm notification |
| Action | Support enabling, disabling, and deleting alarm policies |
Modify an Alarm Rule
Application Scenarios
You can view the detailed information of an alarm rule on the Alarm Rule Details page, and modify the alarm name, alarm policy, alarm contact group, and other information.
Operating steps
- Log in to the cloud monitoring console.
- In the left navigation bar, select Alarm Service > Alarm Rule > Rule Name
- View the alarm details and click the Edit button next to the information to modify it.
- Fill in the relevant content of the alarm rule again, and click Save to complete the modification after making confirmation.
Enable an Alarm Rule
Application Scenarios
After an alarm rule is enabled, the alarm system will start to detect metric data and trigger an alarm message according to the alarm policy.
Operating steps
- Log in to the cloud monitoring console.
- In the left navigation bar, select Alarm Service > Alarm Rule.
- On the Alarm Rule page, click the button in the Alarm State column corresponding to the alarm rule to enable it.
- If you need to perform bulk actions on multiple alarm rules, you can select multiple alarm rules to be enabled and click the Enable button at the top of the list.
Disable an Alarm Rule
Application Scenarios
After an alarm rule is disabled, the alarm system will stop detecting metric data. You can disable the alarm rule as needed to flexibly control the triggering of alarm messages.
Operating steps
- Log in to the cloud monitoring console.
- In the left navigation bar, select Alarm Service > Alarm Rule.
- On the Alarm Rule page, click the button in the Alarm State column corresponding to the alarm rule to disable it.
- If you need to perform bulk actions on multiple alarm rules, you can select multiple alarm rules that need to be disabled and click the Enable button at the top of the list.
Delete an Alarm Rule
Application Scenarios
When you no longer need an alarm rule, you can delete it, and the alarm system will no longer detect monitoring metrics and trigger alarms based on the alarm rule.
Operating steps
- Log in to the cloud monitoring console.
- In the left navigation bar, select Alarm Service > Alarm Rule.
- On the Alarm Rule page, click the button in the action column corresponding to the alarm rule to delete it.
- If you need to perform bulk actions on multiple alarm rules, you can select multiple alarm rules to be deleted and click the Enable button at the top of the list.
Alarm Template
View an Alarm Template
Application Scenarios
You can view existing alarm templates and their detailed information through the Alarm Template in CMS.
Operating steps
- Log in to the cloud monitoring console.
- In the left navigation bar, select Alarm Service > Alarm Template.
- On the Alarm Template page, you can view the detailed information of the specified alarm template. The items in the Alarm Template List and their meanings are as follows:
| Column Name | Meaning |
|---|---|
| Template Name (ID & Name) | The name and unique ID of the alarm template |
| Applicable Products | The cloud products that the alarm template matches |
| Template Policy | The policy content that triggers the alarm rule |
| Number of Alarm Rules | The number of alarm rules bound to the alarm template. The template with bound alarm rules cannot be deleted |
| Action | Delete an alarm template |
Create an Alarm Template
Application Scenarios
When you have a large number of cloud resources, in order to avoid repeatedly defining responsible alarm rules and policies, you can use the Alarm Template function to directly use an existing template when creating or modifying an alarm rule.
Operating steps
- Log in to the cloud monitoring console.
- In the left navigation bar, select Alarm Service > Alarm Template.
- On the Alarm Template page, click Create an Alarm Template.
- On the Create an Alarm Template page, fill in the relevant content of the alarm template.
- Click OK to complete the creation of the alarm template.
| Parameter Type | Parameter | Parameter Description |
|---|---|---|
| Basic Info | Name | The name of the alarm template, used to identify the alarm template. |
| Description | Custom description of the alarm template, descriptive information. | |
| Alarm Object | Product Name | The name of a cloud product that can be managed by CMS. |
| Alarm Rule | Metric Type | The alarm policy can be set through a single metric or multiple metrics. |
| Alarm Metric | Monitoring resource metrics used to trigger an alarm. | |
| Trigger Condition | Set the monitoring metric value type, comparison relationship, threshold range, and duration that trigger an alarm. When the monitored resource metric reaches the trigger condition, the system will trigger an alarm message. If the metric type is set as single-metric, only one trigger condition is supported. If the metric type is set as multi-metric, one or more trigger conditions are supported. You can select alarm triggering when all metrics meet the condition (&&) or when only one metric meets the condition ( | |
| Alarm Level | It is used to define the severity of an alarm, and supports setting urgent, major, minor, and reminder levels. | |
| Alarm Mode | Notification Mode | Select one or more channels, and currently support in-site messaging and SMS. |
Alarm Message
Manage an Alarm Contact Group
Application Scenarios
You can view existing alarm contact groups and their detailed information through the Alarm Message in CMS.
Operating steps
- Log in to the cloud monitoring console.
- In the left navigation bar, select Alarm Service > Alarm Message.
- On the Alarm Message page, you can view the detailed information of the specified alarm contact group. The items in the Alarm Contact Group List and their meanings are as follows:
- Click Create a Contact Group, and fill in the name of the alarm contact group and the name of the internal user you want to bind to complete the creation.
| Column Name | Meaning |
|---|---|
| Alarm Contact Group | The name of the alarm contact group |
| Internal User | All internal users bound in the alarm contact group |
| Creation Time | The creation time of the alarm contact group |
| Last Modified Time | The last modified time of the alarm contact group |
| Action | Edit and delete an alarm contact group: the alarm contact groups that have been bound by alarm rules cannot be deleted |
Log Service
Query Log Information
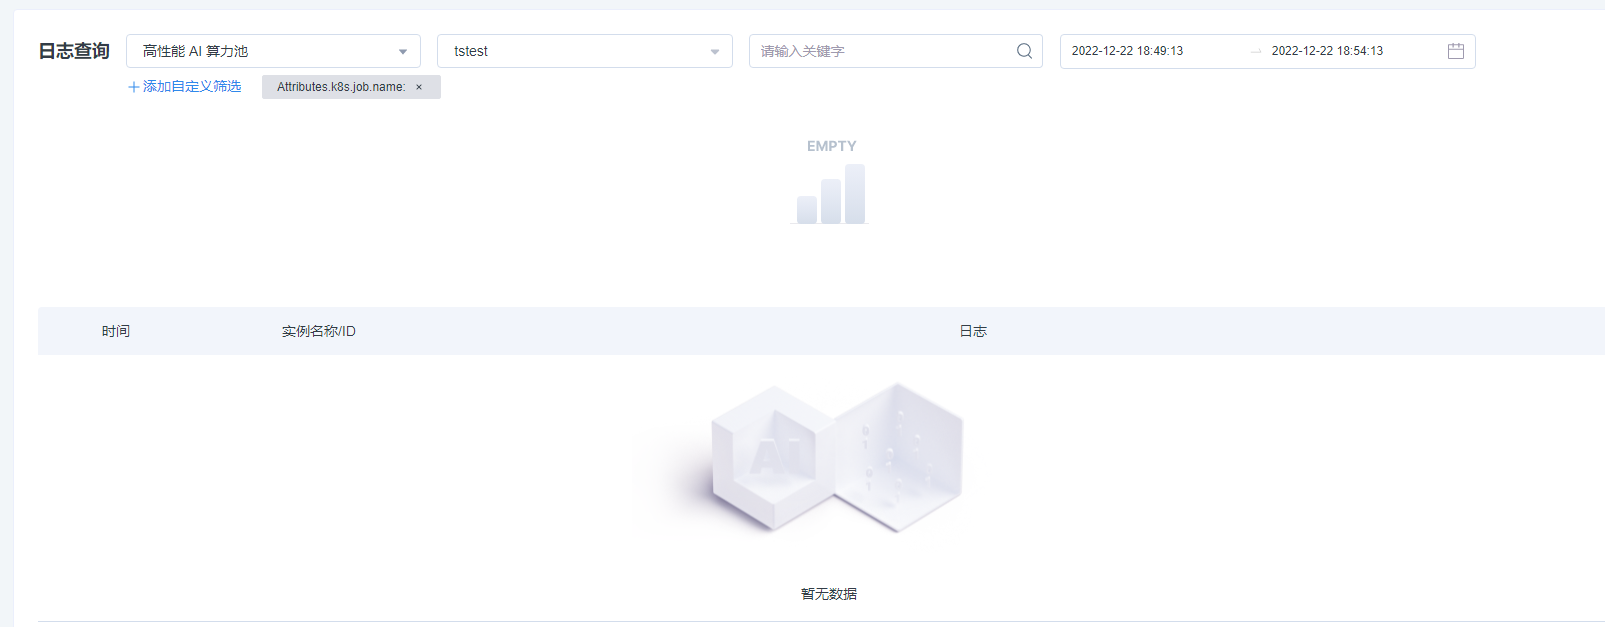
Application Scenarios
You can query the log information of cloud product resources in Log Service, filter the log information by cloud product name, date range, log keywords, and alarm level, and finally view the required relevant log content.
You can filter by JOB, Worker, Container in the log information of the AI computing pool (ACP) product.
You can filter by log alarm level in the ACP to filter out the standard training log level information of general training frameworks, such as Pytorch and Tensorflow, of training tasks, including the following six levels:
- Trace: Trace logs are used to output the most detailed debugging information, including some very subtle actions and state information. These logs are usually used during development and debugging, and this information is unnecessary for a normally functioning system.
- DEBUG: A logging level used to output debugging information, typically used during development and debugging.
- INFO: A logging level used to output general information, providing some runtime states and hints.
- WARNING: A log level used to output warning messages, indicating some possible problems or potential errors.
- ERROR: A log level used to output error messages, indicating some critical errors or exceptions.
- FATAL: A log level used to output critical error messages, indicating some critical errors or emergency conditions that may interrupt the program.
Operating steps
- Log in to the cloud monitoring console.
- In the left navigation bar, select Log Service > Log Query.
- On the Log Query page, select the name of the sub-product whose logs need to be viewed.
- Click the Filter by Time box to select the log time range to be viewed.
- In the search box, enter the keyword of the log to be viewed and make confirmation.
- View the log information related to the sub-product to be viewed in the list, including time and log content.
| Column Name | Meaning |
|---|---|
| Cloud Product Name | Select the cloud product whose logs need to be viewed |
| Resource Instance | Select the resource instance whose logs need to be viewed |
| Custom Filter | Different custom filter conditions can be added to resource instances of different cloud products |
| Search by Keyword | In the search box, enter the keyword of the log to be viewed and make confirmation |
| Filter by Time | Click the Filter by Time box to select the log time range to be viewed |
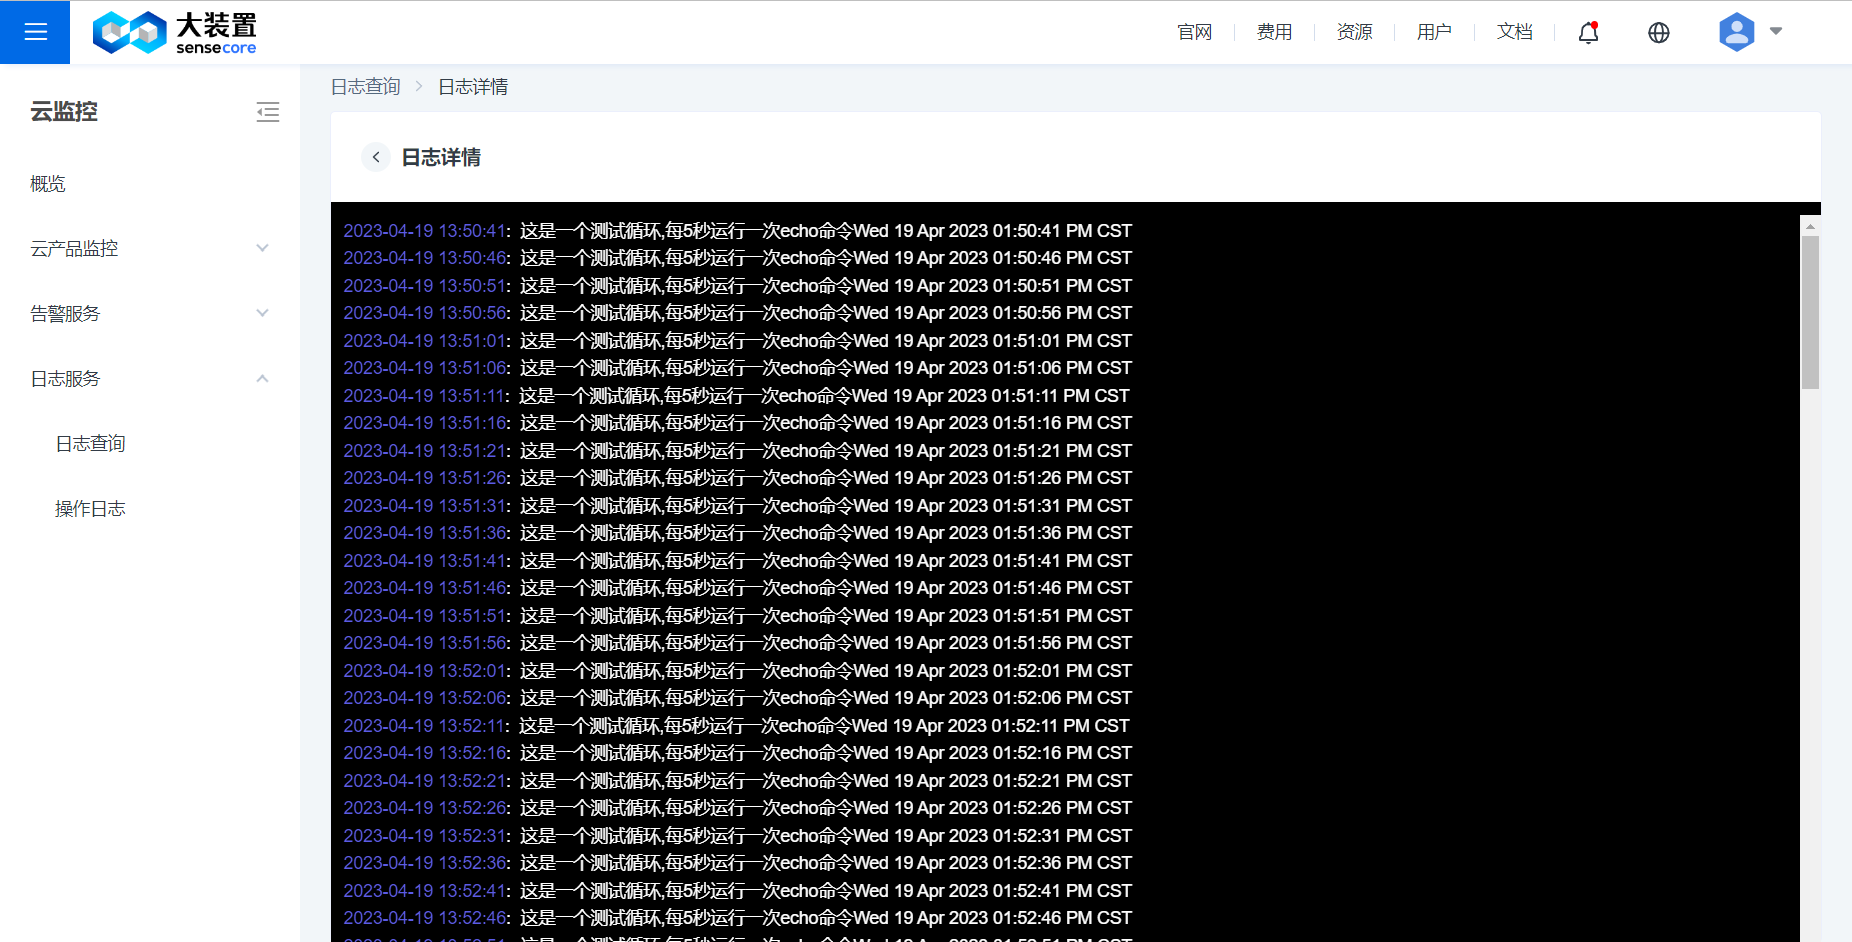
Query Log Details
Application Scenarios
You can filter the logs you need in the Query log interface and skip to the Log details interface to view the original log content in the context of high information density.
Support is available for log comparison, content retrieval, log order, etc. will continue on this page later.
Operating steps
- Log in to the cloud monitoring console.
- In the left navigation bar, select Log Service > Log Query.
- On the Log Query page, select the name of the sub-product whose logs need to be viewed.
- Click the Filter by Time box to select the log time range to be viewed.
- In the search box, enter the keyword of the log to be viewed and make confirmation.
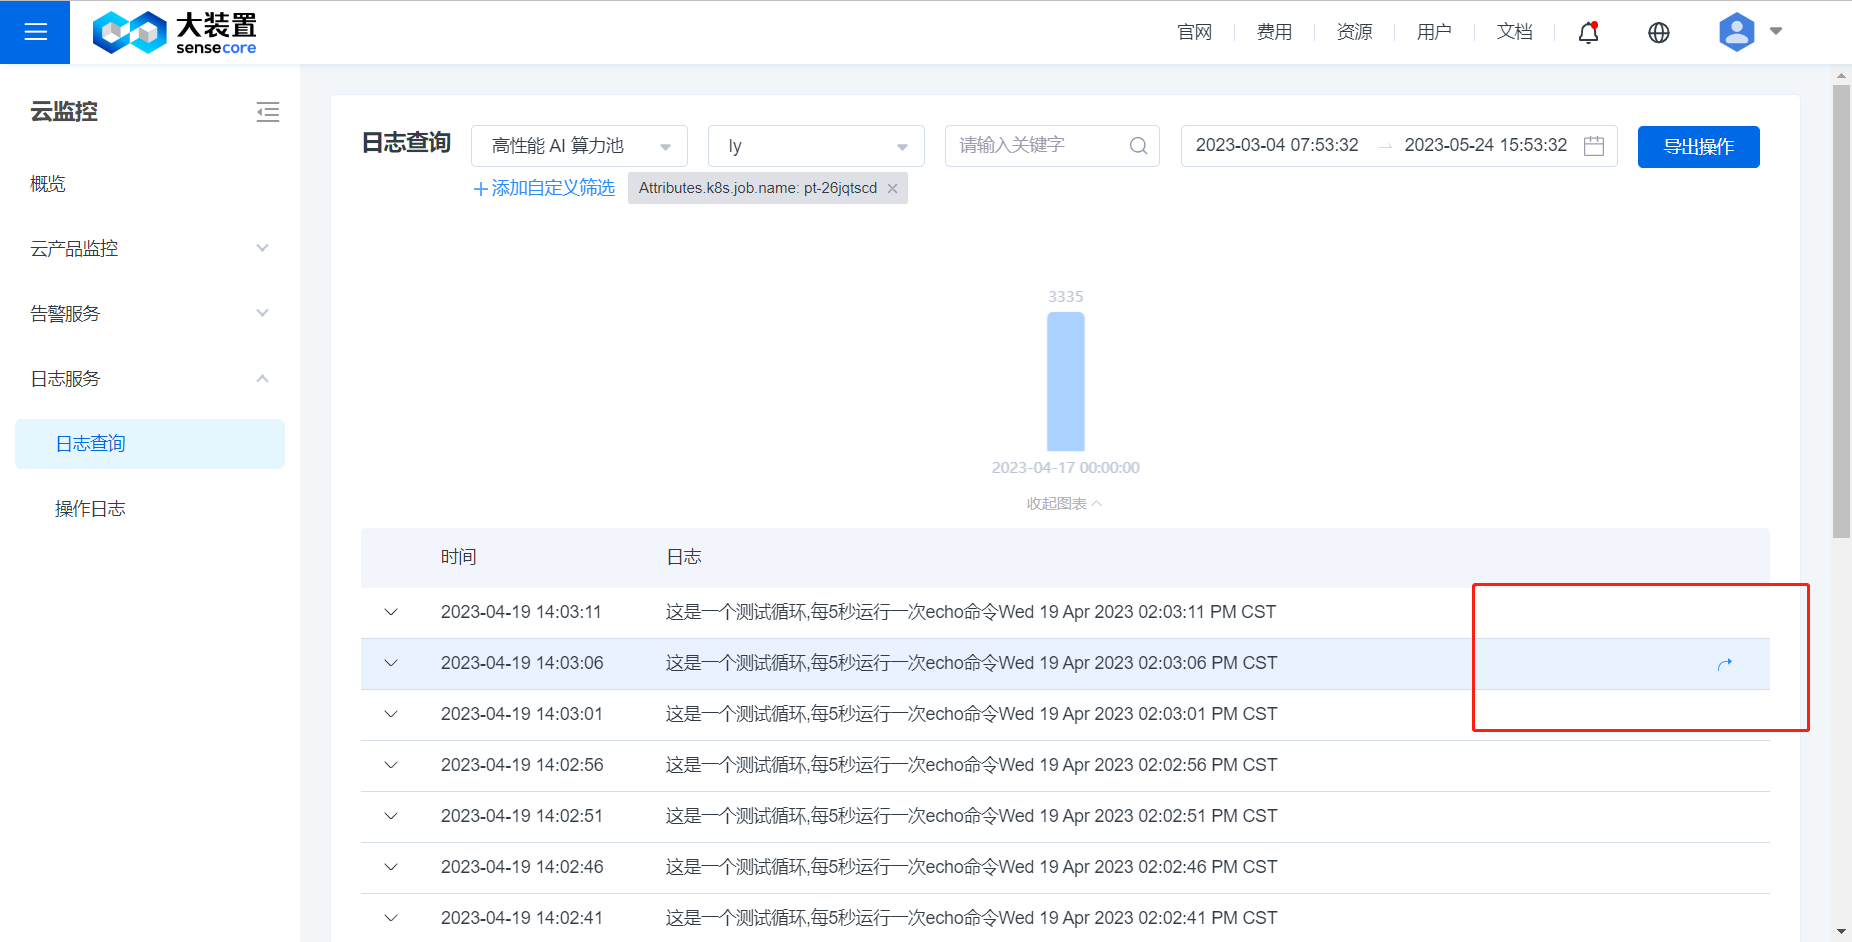
- View the log information related to the sub-product to be viewed in the list, including time and log content.
- When the cursor hovers over the log entry, a Skip button will surface on the far right side of the log entry, as shown in the following figure.
- Click the Skip button to enter the Query log details interface, as shown in the following figure.
Export Log Information
Application Scenarios
The cloud monitoring log service provides the Export log function, which can export the log data in the cloud monitoring log service to a specified object storage location and provide the function of downloading log files from the object storage for a more in-depth analysis and processing by the user.
The following are a few application scenarios for the Export log function:
- Security analysis: It downloads logs and works in conjunction with security analysis tools for operations such as threat analysis, intrusion detection and incident response.
- Log archive: It exports logs to long-term storage in order to meet compliance requirements or backup needs.
- Data analysis: It exports logs to data analysis platforms, such as Elasticsearch, Kibana, etc., for in-depth data analysis to better understand system behavior and performance.
Reasons why logs need to be imported to object storage first
- File size limitation: In some training scenarios, the log file may be extremely large and exceed the download limit or cause unstable downloads, while exporting logs to object storage first allows for a better experience with object storage tools for downloading.
- Security: By exporting logs to object storage first, you can control data security through permission controls and other functions, you can also encrypt the data and perform other operations to protect the confidentiality and integrity of the data.
- Subsequent processing: The operation of exporting logs to object storage first can facilitate subsequent data processing, such as data backup, data analysis, etc., and makes it possible to easily share data to other teams or departments.
In general, the operation of exporting logs to object storage can improve the stability and speed of downloads, protect the security and integrity of data, and facilitate subsequent data processing and sharing.
Operating steps
- Log in to the cloud monitoring console.
- In the left navigation bar, select Log Service > Log Query.
- On the Log Query page, select the name of the sub-product whose logs need to be viewed.
- Click the Filter by Time box to select the log time range to be viewed.
- In the search box, enter the keyword of the log to be viewed and make confirmation.
- View the log information related to the sub-product to be viewed in the list, including time and log content.
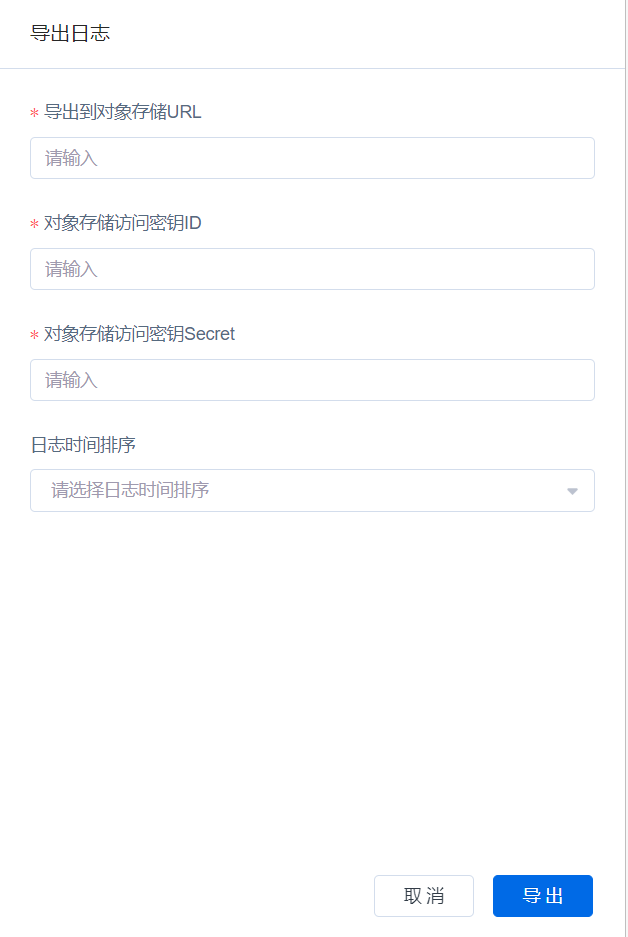
- Click Export Action - Export Log
- Please the enter object storage URL, access key ID, access key secret key, and optional log export order
- Click Export Log
- Select from the export logs to download the successfully exported logs via browser
Tips on how to get the URL of object storage service
- Taking the object storage service of SenseCore as an example. Go to the SenseCore object storage bucket information page and view the URL of the object storage service. You need to use "Storage Bucket Domain Name Information (Internet Access)" and add "https://" in the front of the Internet address, and get access key and secret key of the owner of this storage bucket.
- On the Cloud Monitoring Log Query page, click Export and enter the URL of the object storage service, access key ID (AK) and the secret key (SK) obtained in the previous step and click Export.
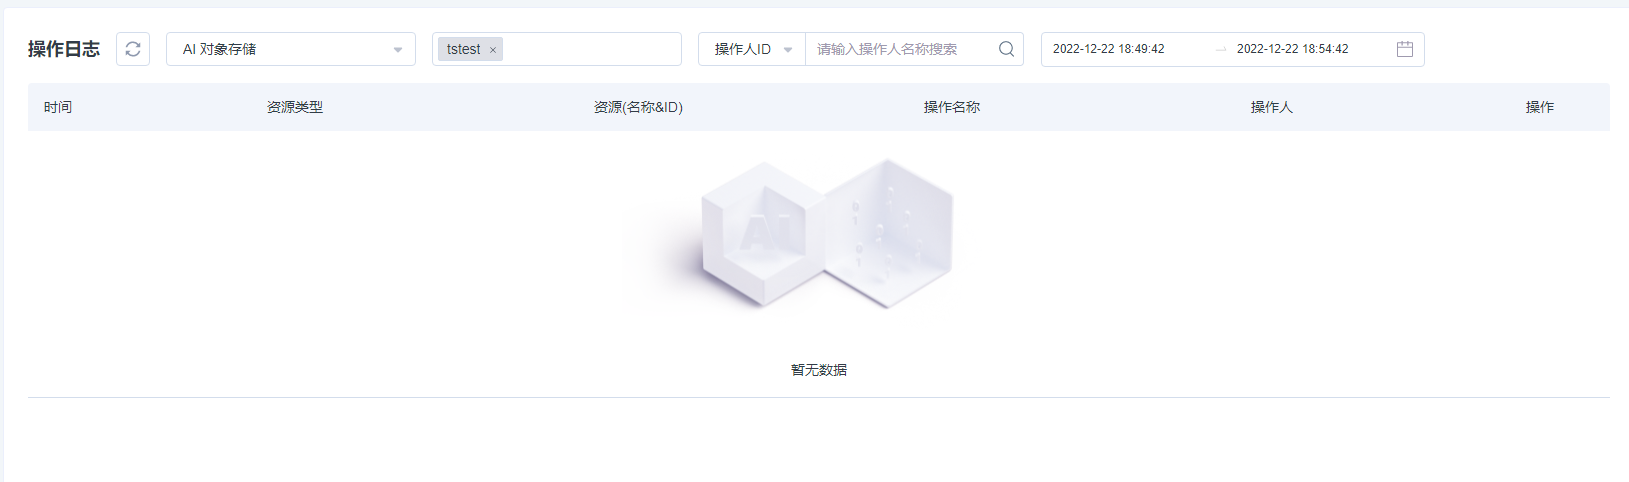
Action Log
Application Scenarios
In the action log, you can view the records of actions performed by different users on the resources of each cloud product at different points in time, helping you to track changes and conduct troubleshooting when finding that the resources have undergone unknown changes or problems occur.
Operating steps
- Log in to the cloud monitoring console.
- In the left navigation bar, select Log Service > Action Log.
- On the Action Log page, you can view the detailed information of an action log. The items in the log and their meanings are as follows:
| Column Name | Meaning |
|---|---|
| Time | The exact time when the action occurred |
| Resource Type | The type of the resource on which the action is performed |
| Resource Name & ID | The name & ID of the resource on which the action is performed |
| Action Name | The name of the action performed on the resource |
| Operator | The name of the user who initiates the action |
| Details | Click to view the log information of the action |